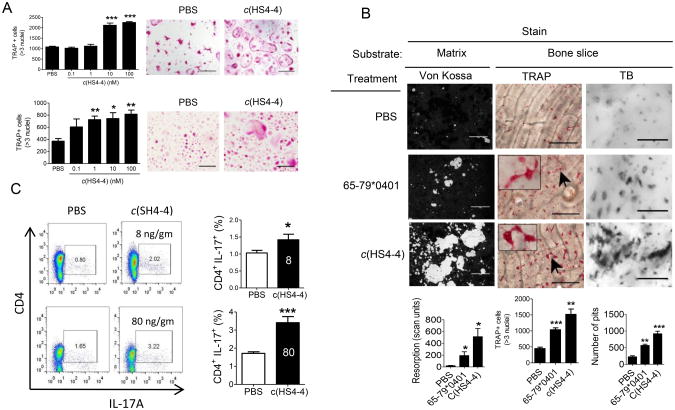
Figure 2.
Functional activity of c(HS4-4). A. BMCs harvested from DBA/1 mice (upper panel) or human PBMCs (lower panel) were cultured in triplicates with M-CSF and RANKL in the presence of various concentrations of c(HS4-4) or PBS and TRAP-positive multinucleated cells were counted. Representative microscopic fields from treated with PBS or 100 nM c(HS4-4) are shown on the right upper and lower panels. B. c(HS4-4) facilitates bone degradation in vitro. Primary DBA/1 mouse BMCs were cultured in triplicates with M-CSF and RANKL atop bone matrices (left panel), or bone slices (middle and right panels) in the presence of PBS, 58 μM of the SE ligand 65-79*0401, or 100nM of c(HS4-4) in 48-well culture plates. Left panel: Matrix degradation was quantified on day 15 by digital scanning of tissue culture wells. Black areas represent intact matrix; white areas correspond to matrix degradation. Middle panel: BMCs cultures atop bone slices were stained for TRAP and OCs were counted. Representative OCs are identified by arrow and their enlarged image is shown in the box in the left upper corner. Right panel: Bone slice-attached OCs were removed and wells were stained with toluidine blue (TB). Bone pits are shown as black dots. Horizontal bars in all photos correspond to 100 μm. Bar graphs in the bottom represent mean ± SEM events from quintuplicate cultures in each of the three respective panels. C. c(HS4-4) facilitates Th17 polarization. Mice were injected with CII/CFA together with either 8 or 80 ng/gm BW of c(HS4-4), or PBS as detailed in Materials and Methods. Abundance of CD4+ IL-17A+ cells in DLNs was determined on day 7 by flow cytometry. Left-side images display representative dot plots. Bar graphs on the right side display mean ± SEM of data obtained from 6 DLN (3 mice) in each group. All flow cytometry data were determined in duplicate samples from each DLN. White-color numbers within the black bars represent the administered dose (ng/gm BW) of c(HS4-4).

