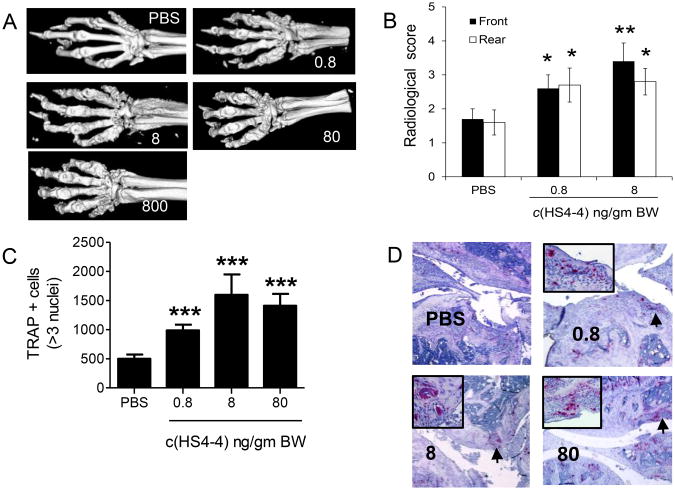
Figure 4.
Bone destruction effects of c(HS4-4) A. Representative micro-CT images of CIA mice treated with various doses of c(HS4-4). B. Radiological scores of rear and front paws (N = 10) of CIA mice treated with either 0.8 or 8.0 ng/gm BW c(HS4-4) or PBS. C. Quantification of TRAP-positive cells in CIA joint tissues of mice treated with various concentrations of c(HS4-4), or PBS (N=10 in the PBS group and 5 per treatment group). D. Representative views of TRAP-stained knee joint tissue sections of CIA mice treated with various doses of c(HS4-4), or PBS). Magnification: × 10. An area of high OC abundance is marked by asterisk, and shown in a × 40 magnification in the boxed image in the left upper corner.

