
TABLE 2.
Reported associations of Trails B with predicting driving safety (studies with no association shaded in gray)
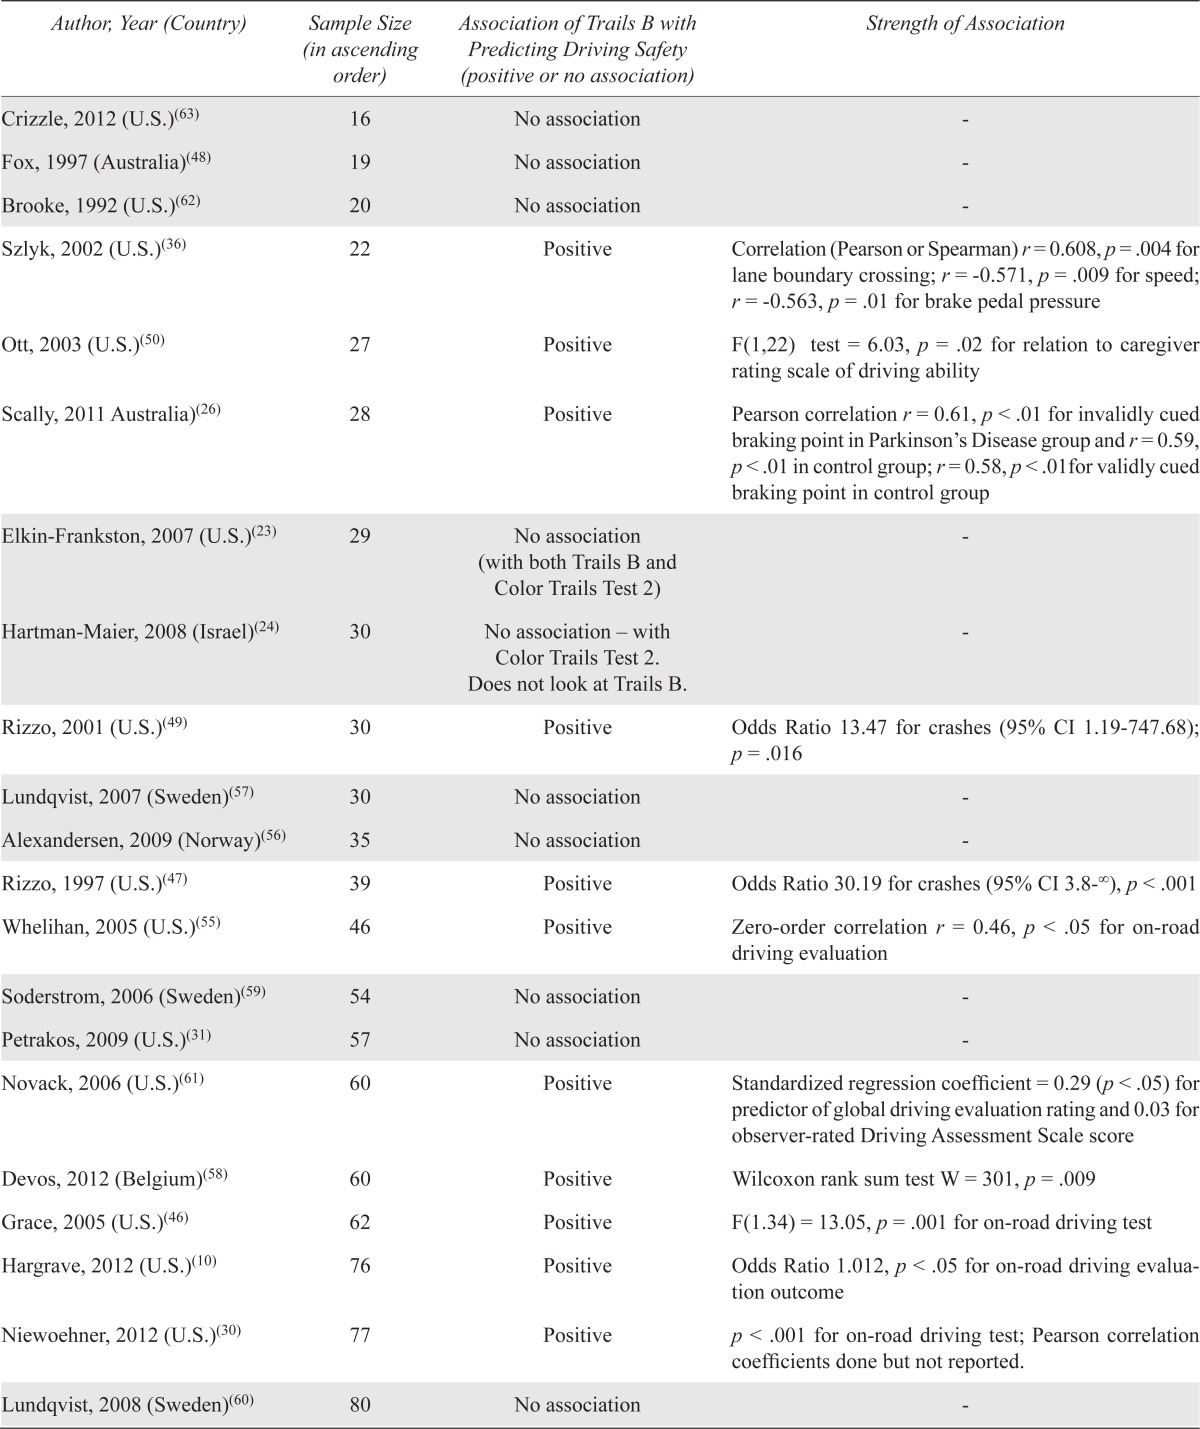
| Author, Year (Country) | Sample Size (in ascending order) | Association of Trails B with Predicting Driving Safety (positive or no association) | Strength of Association |
|---|---|---|---|
| Crizzle, 2012 (U.S.)(63) | 16 | No association | - |
| Fox, 1997 (Australia)(48) | 19 | No association | - |
| Brooke, 1992 (U.S.)(62) | 20 | No association | - |
| Szlyk, 2002 (U.S.)(36) | 22 | Positive | Correlation (Pearson or Spearman) r = 0.608, p = .004 for lane boundary crossing; r = −0.571, p = .009 for speed; r = −0.563, p = .01 for brake pedal pressure |
| Ott, 2003 (U.S.)(50) | 27 | Positive | F(1,22) test = 6.03, p = .02 for relation to caregiver rating scale of driving ability |
| Scally, 2011 Australia)(26) | 28 | Positive | Pearson correlation r = 0.61, p < .01 for invalidly cued braking point in Parkinson’s Disease group and r = 0.59, p < .01 in control group; r = 0.58, p < .01for validly cued braking point in control group |
| Elkin-Frankston, 2007 (U.S.)(23) | 29 | No association (with both Trails B and Color Trails Test 2) | - |
| Hartman-Maier, 2008 (Israel)(24) | 30 | No association – with Color Trails Test 2. Does not look at Trails B. | - |
| Rizzo, 2001 (U.S.)(49) | 30 | Positive | Odds Ratio 13.47 for crashes (95% CI 1.19–747.68); p = .016 |
| Lundqvist, 2007 (Sweden)(57) | 30 | No association | - |
| Alexandersen, 2009 (Norway)(56) | 35 | No association | - |
| Rizzo, 1997 (U.S.)(47) | 39 | Positive | Odds Ratio 30.19 for crashes (95% CI 3.8−∞), p < .001 |
| Whelihan, 2005 (U.S.)(55) | 46 | Positive | Zero-order correlation r = 0.46, p < .05 for on-road driving evaluation |
| Soderstrom, 2006 (Sweden)(59) | 54 | No association | - |
| Petrakos, 2009 (U.S.)(31) | 57 | No association | - |
| Novack, 2006 (U.S.)(61) | 60 | Positive | Standardized regression coefficient = 0.29 (p < .05) for predictor of global driving evaluation rating and 0.03 for observer-rated Driving Assessment Scale score |
| Devos, 2012 (Belgium)(58) | 60 | Positive | Wilcoxon rank sum test W = 301, p = .009 |
| Grace, 2005 (U.S.)(46) | 62 | Positive | F(1.34) = 13.05, p = .001 for on-road driving test |
| Hargrave, 2012 (U.S.)(10) | 76 | Positive | Odds Ratio 1.012, p < .05 for on-road driving evaluation outcome |
| Niewoehner, 2012 (U.S.)(30) | 77 | Positive | p < .001 for on-road driving test; Pearson correlation coefficients done but not reported. |
| Lundqvist, 2008 (Sweden)(60) | 80 | No association | - |
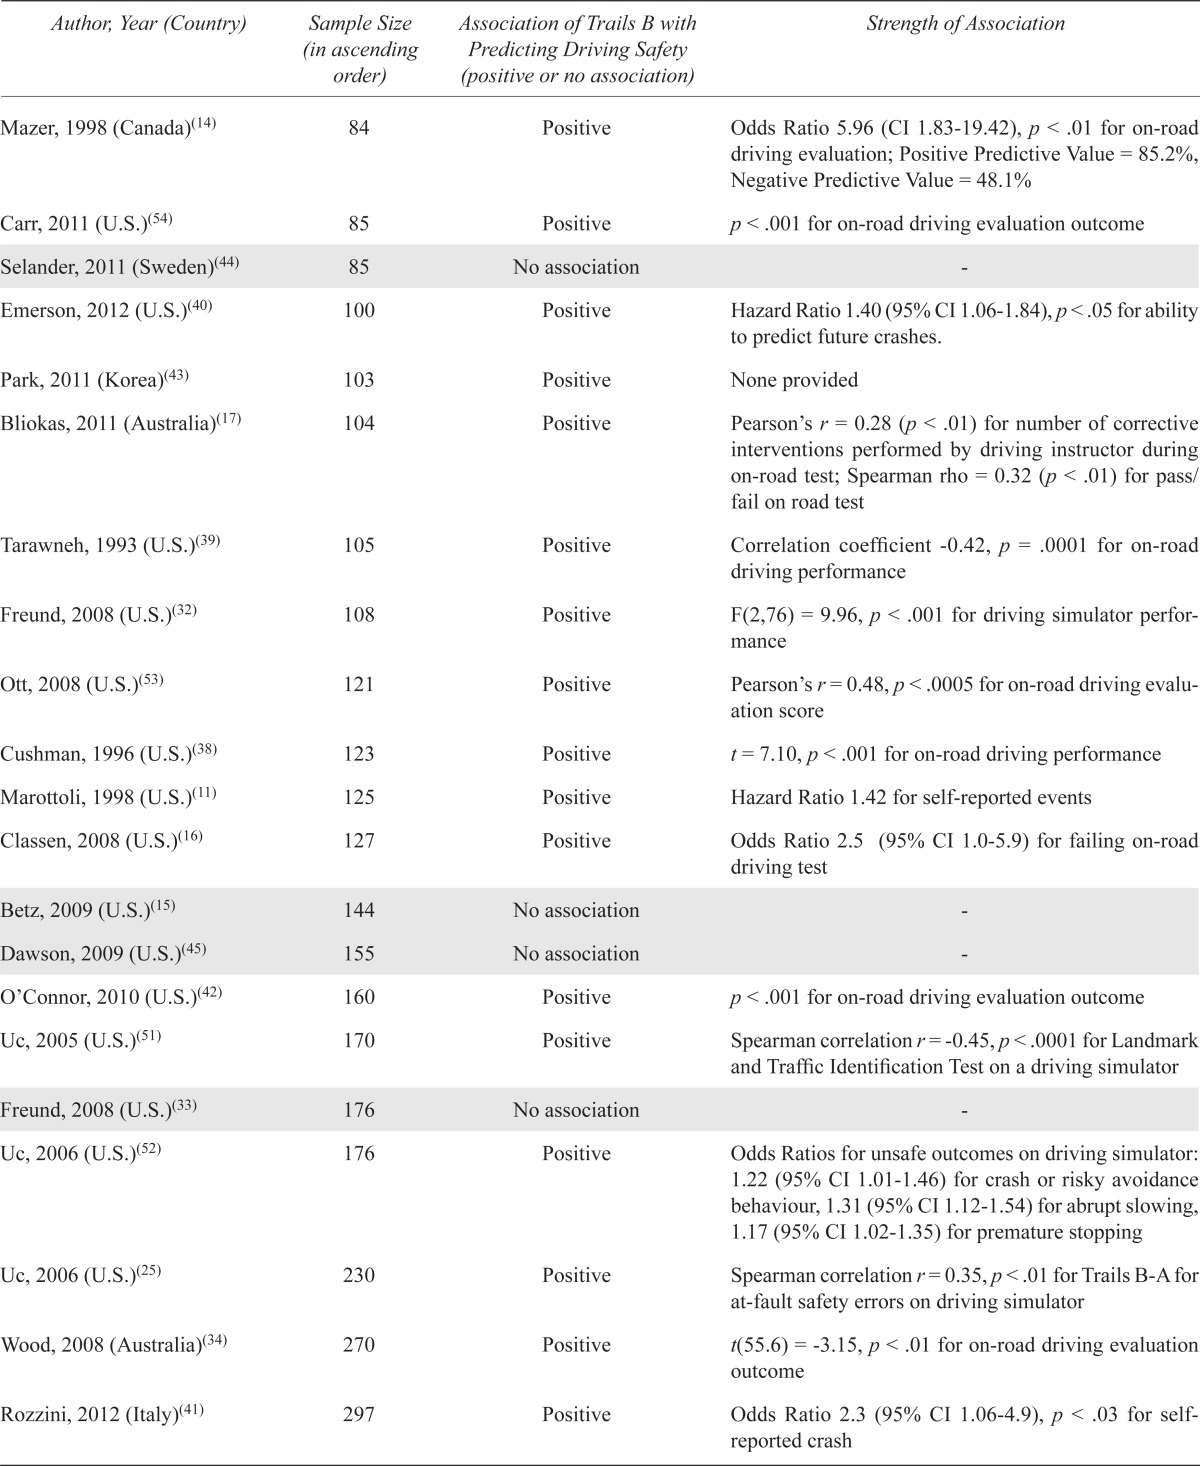
| Mazer, 1998 (Canada)(14) | 84 | Positive | Odds Ratio 5.96 (CI 1.83–19.42), p < .01 for on-road driving evaluation; Positive Predictive Value = 85.2%, Negative Predictive Value = 48.1% |
| Carr, 2011 (U.S.)(54) | 85 | Positive | p < .001 for on-road driving evaluation outcome |
| Selander, 2011 (Sweden)(44) | 85 | No association | - |
| Emerson, 2012 (U.S.)(40) | 100 | Positive | Hazard Ratio 1.40 (95% CI 1.06–1.84), p < .05 for ability to predict future crashes. |
| Park, 2011 (Korea)(43) | 103 | Positive | None provided |
| Bliokas, 2011 (Australia)(17) | 104 | Positive | Pearson’s r = 0.28 (p < .01) for number of corrective interventions performed by driving instructor during on-road test; Spearman rho = 0.32 (p < .01) for pass/fail on road test |
| Tarawneh, 1993 (U.S.)(39) | 105 | Positive | Correlation coefficient −0.42, p = .0001 for on-road driving performance |
| Freund, 2008 (U.S.)(32) | 108 | Positive | F(2,76) = 9.96, p < .001 for driving simulator performance |
| Ott, 2008 (U.S.)(53) | 121 | Positive | Pearson’s r = 0.48, p < .0005 for on-road driving evaluation score |
| Cushman, 1996 (U.S.)(38) | 123 | Positive | t = 7.10, p < .001 for on-road driving performance |
| Marottoli, 1998 (U.S.)(11) | 125 | Positive | Hazard Ratio 1.42 for self-reported events |
| Classen, 2008 (U.S.)(16) | 127 | Positive | Odds Ratio 2.5 (95% CI 1.0–5.9) for failing on-road driving test |
| Betz, 2009 (U.S.)(15) | 144 | No association | - |
| Dawson, 2009 (U.S.)(45) | 155 | No association | - |
| O’Connor, 2010 (U.S.)(42) | 160 | Positive | p < .001 for on-road driving evaluation outcome |
| Uc, 2005 (U.S.)(51) | 170 | Positive | Spearman correlation r = −0.45, p < .0001 for Landmark and Traffic Identification Test on a driving simulator |
| Freund, 2008 (U.S.)(33) | 176 | No association | - |
| Uc, 2006 (U.S.)(52) | 176 | Positive | Odds Ratios for unsafe outcomes on driving simulator: 1.22 (95% CI 1.01–1.46) for crash or risky avoidance behaviour, 1.31 (95% CI 1.12–1.54) for abrupt slowing, 1.17 (95% CI 1.02–1.35) for premature stopping |
| Uc, 2006 (U.S.)(25) | 230 | Positive | Spearman correlation r = 0.35, p < .01 for Trails B-A for at-fault safety errors on driving simulator |
| Wood, 2008 (Australia)(34) | 270 | Positive | t(55.6) = −3.15, p < .01 for on-road driving evaluation outcome |
| Rozzini, 2012 (Italy)(41) | 297 | Positive | Odds Ratio 2.3 (95% CI 1.06–4.9), p < .03 for self-reported crash |
| Kantor, 2004 (U.S.)(29) | 664 | Positive Reports positive association as cues needed to complete Trails B – methodology for determining “cue score” was not mentioned. |
Statistical analysis for Trails B alone not provided in clear terms |
| Staplin, 2003 (U.S.) (original MaryPODS data)(13) | 1876 | Positive The original data included two years of prospective crash data. |
Odds Ratio 3.50, p < .01 for at-fault crashes; Odds Ratio 1.72, p < .01 for frequencies of violations |
| Staplin, 2003 (U.S.) (updated MaryPODS data)(35) | 1876 | No association This updated analysis included one additional year of driving experience. |
- |
| Ball, 2006 (U.S.)(12) | 1910 | Positive | Odds Ratio 1.21 (95% CI 1.01–1.44), p = .04 for future at-fault crashes |
| Stutts, 1998 (U.S.)(37) | 3238 | Positive | Odds Ratio 1.06 (95% CI 1.01–1.11) for crash involvement |