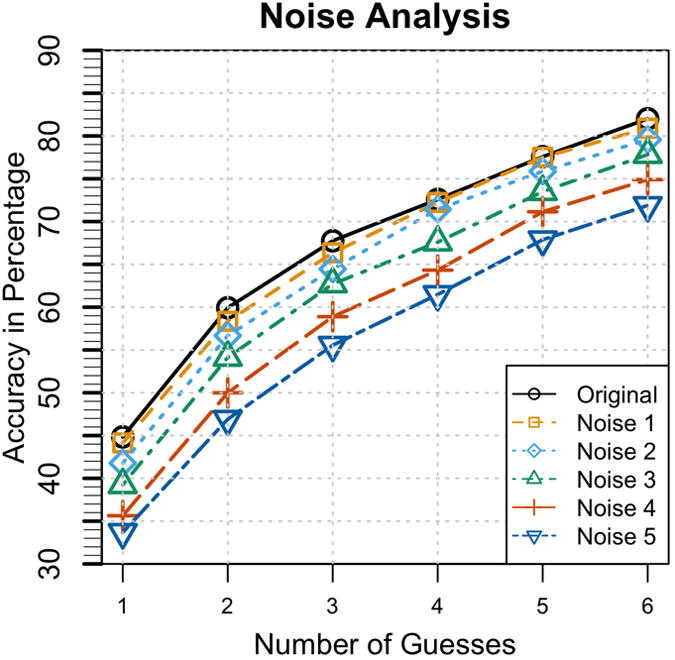
Figure 5. Noise Analysis.

The result of the noise analysis with varying degrees of noise versus performance of the ‘top N loci’ selection method compared to the classification performance with no noise (the original). From this plot, it is shown that AudioGene is robust to the amount of noise expected from mis-calibration and test-retest variability.
