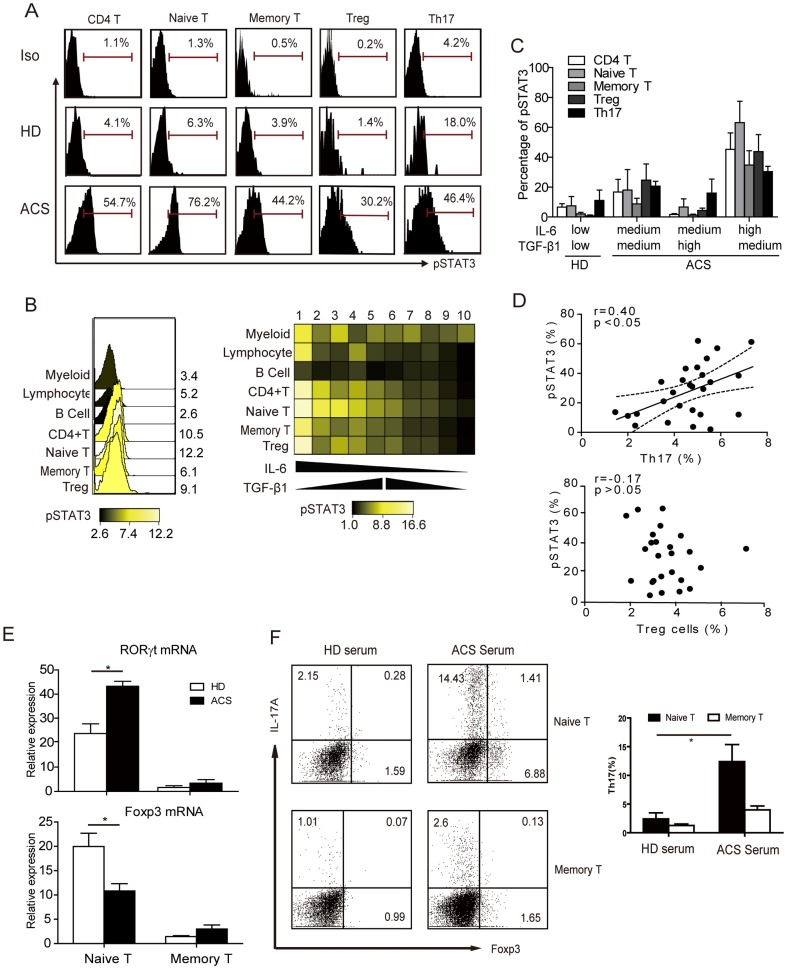
Figure 3. IL6-STAT3 signaling in patients with ACS.
(A) Representative FCM histograms of pSTAT3 levels in CD4+ T cells, naïve T cells, memory T cells, Treg cells and Th17 cells in HDs and ACS patients. Data are representative of 5 independent experiments. (B) Overlay and heatmap summary of STAT3 phosphorylation in immune cell subtypes from PBMCs defined as: myeloid cells, lymphocytes, B cell, CD4+ T cells, naïve T cells, memory T cells and Treg cells in ACS patients (n = 10) with different levels of IL-6 and TGF-β1. The color scale indicates the difference in the log2 mean intensity of pSTAT3. (C) Statistical analysis of the expression of the pSTAT3 levels in T cell subsets from ACS patients (n = 10) with different levels of IL-6 and TGF-β1 (Figure S3). (D) Correlation of individual Th17 and Treg cells with the levels of pSTAT3 in ACS patients (n = 25). The relationships are also depicted using linear regression (solid line) with 95% confidence bands (interrupted lines). (E) Averaged RORγt and FOXP3 mRNA expression levels in T cell subsets from ACS patients (n = 10), as determined by real time PCR from ACS patients, normalized with GAPDH mRNA levels. Representative FCM results. (F) Inducing Th17 cell from naïve T cells and memory T cells with ACS serum. Cells were purified from HD PBMCs by MACS and co-cultured with selective ACS serum (containing high level IL-6 and TGF-β1), as previously described. Data are representative of 5 independent experiments. *: P<0.05 is considered statistically significant.

