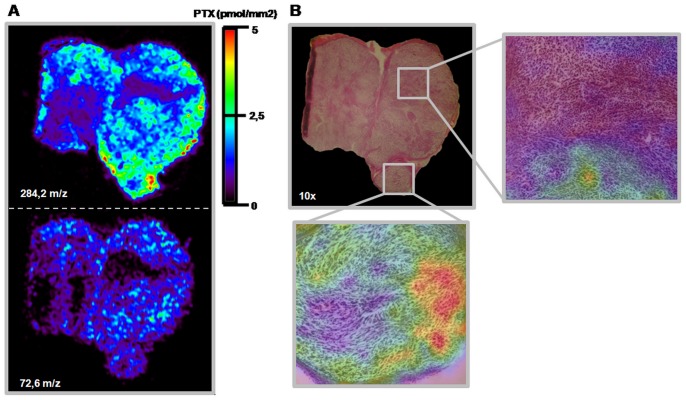
Figure 5. Overlapping MS, MS/MS and HE images of three adjacent slice of melanoma.
A) MS distribution of peak m/z 284.2 in treated (PTX 60 mg/kg) melanoma reflects MS/MS distribution of the m/z 284.2 to m/z 72,6 transition. B) HE stained 10×optical image shows that the cell compartment is uniform. The enlargements show superimposed histological and molecular data. No differences in tissue histology can be seen in the areas where the drug is more concentrated.

