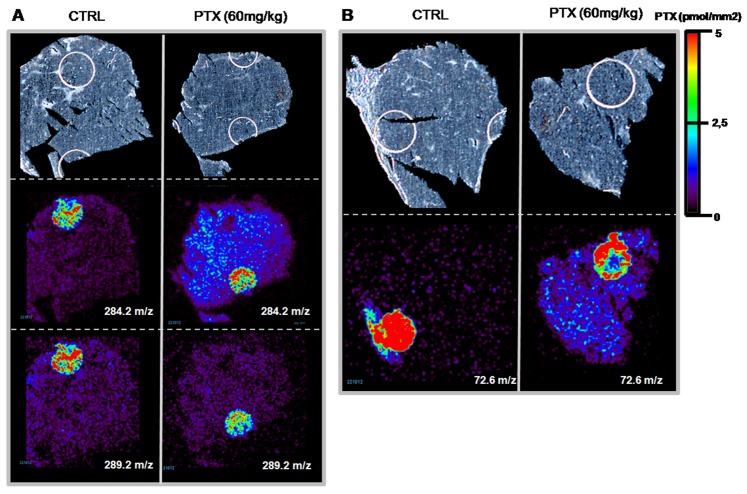
Figure 6. PTX distribution in 1A9 xenografts.
Tissue sections of control (CTRL) and PTX-treated (60 mg/kg) ovarian tumors. A) Upper panels: optical image; middle panels: distribution of PTX (ion m/z 284), inside tissue and spotted on sections 5 pmol/mm2; lower panels: internal standard (ion m/z 289.2), spotted 5 pmol/mm2 on tissue. B) Optical images in upper panels and MS/MS distribution of ion m/z 72.6 derived from fragmentation of peak m/z 284.2 in lower panels.

