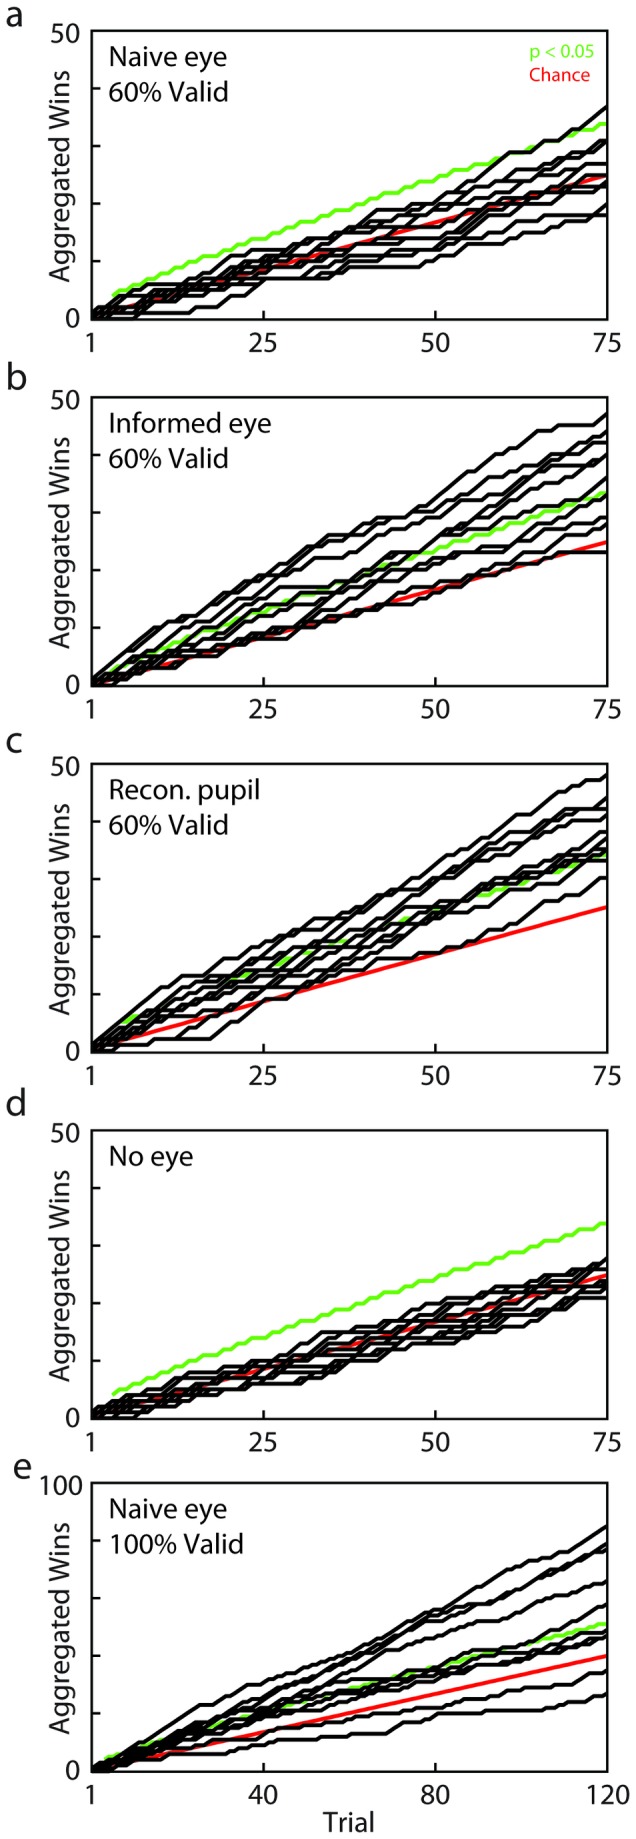
Figure 5. Individual performance across conditions.

Learning curves for the 5 different experimental conditions (Black lines: aggregate number of wins for each individual; red line: chance level; green line: 5% significance level for Binomial test at the given number of games). Note that all preceding games are considered in this computation, such that learned information has to persist longer if learning starts later. a) naïve-eye b) informed-eye c) reconstructed-pupil d) no-eye control condition e) naïve-eye (100% validity).
