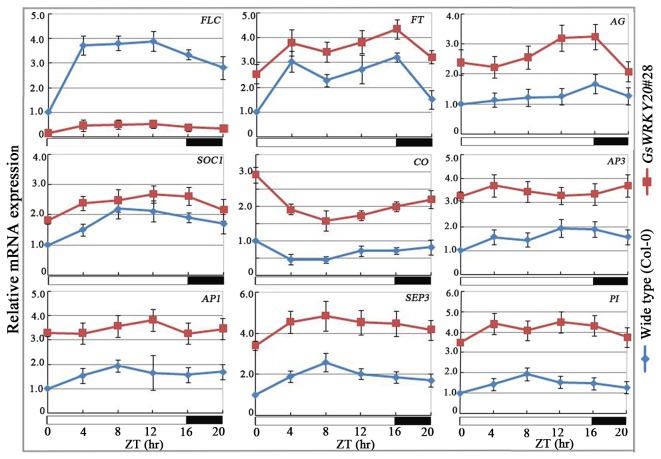
Figure 5. The effect of GsWRKY20 over-expression on the transcription of FLC, FT, SOC1, CO, AP1, SEP3, AG, PI and AP3.
Ten-day-old WT and GsWRKY20 ox seedlings were harvested every 4 h during LD condition, and mRNA expression level was determined by qRT-PCR. Each value is the mean ±SE of three independent measurements, error bars represent the standard deviation (n=3). White and black bars at the bottom represent light and dark phases, respectively. ZT, Zeitgeber.

