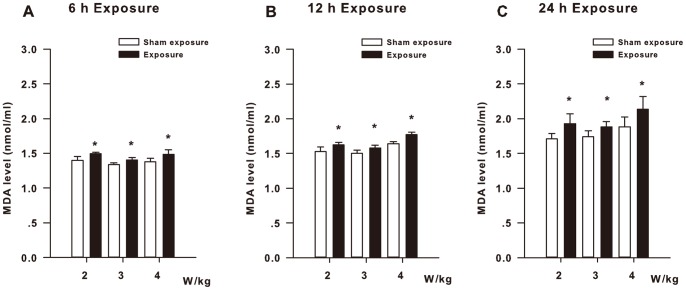
Figure 3. MDA levels of the HLE B3 cells exposed to RF.
(A) The MDA levels of the HLE B3 cells exposed to RF (SAR: 2, 3, or 4 W/kg) for 6 h. (B) The MDA levels of the HLE B3 cells exposed to RF (SAR: 2, 3, or 4 W/kg) for 12 h. (C) The MDA levels of the HLE B3 cells exposed to RF (SAR: 2, 3, or 4 W/kg) for 24 h. *P<0.05, as compared with the corresponding sham-exposure subgroups.

