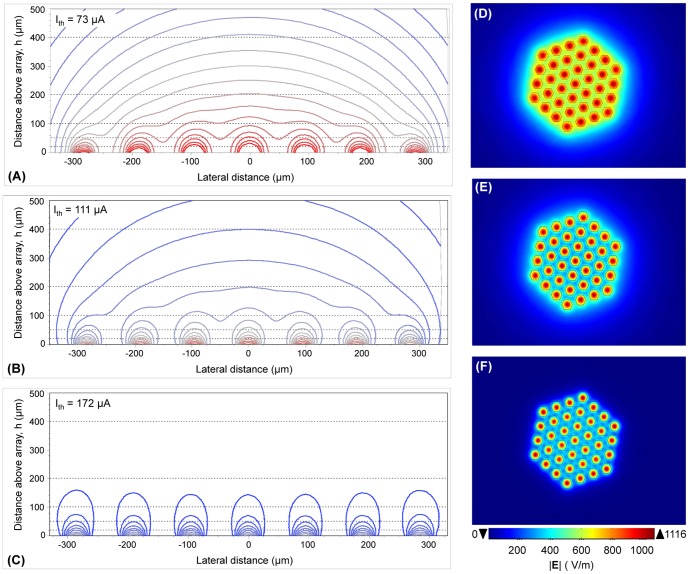
Figure 3. Simulated electric field in the h = 0 µm (A–C) and h = 100 µm (D–F) plane, as well as electric potential (G–I) in an xz-plane (see figure 1) during multielectrode stimulation for the following electrode configurations: MP (A, D and G), QMP at a QMPF of 0.5 (B, E and H), and hexagonal (C, F and I).
The isopotential contours are equi-spaced, ranging from 0.05 to 0.7 V in steps of 0.01 V, with the higher potentials occurring in the plane of the electrode array. Threshold current, Ith, is shown in the upper left corner of each panel. Electrode diameter and center-to-center electrode spacing were 50 µm and 55 µm, respectively. Note that the panels G-I are zoomed in views of the volume conductor domain.

