
Figure 5. Effect of Nox4 siRNA on TGF-β1 mediated effect on Nox4 and SOD1 expression.
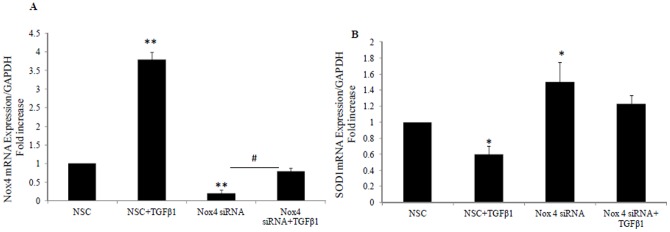
Real time PCR showing Nox4 mRNA expression (A) and SOD1 mRNA expression (B) following TGF-β1 exposure in the presence of non specific control siRNA (NSC) or Nox4 siRNA for 24 hrs. Data is normalised by GAPDH and expressed as mean ± SEM; n = 3. * P<0.05 and #P<0.0005 and ** P<0.0001 vs. control or indicated experimental conditions.