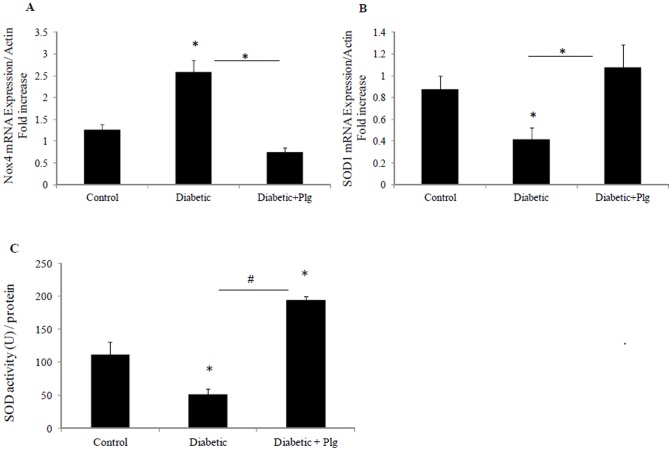
Figure 8. Expression of oxidative stress markers, Nox4 and SOD1 in diabetic mice in the presence and absence of plumbagin.
A) Nox4 mRNA expression normalised to Actin. B) Normalized SOD1 mRNA expression. C) SOD activity expressed as unit/mg of protein. Results are expressed as mean ± SEM; n = 5-7. #P<0.005 and *P<0.05 vs. control or indicated experimental conditions.

