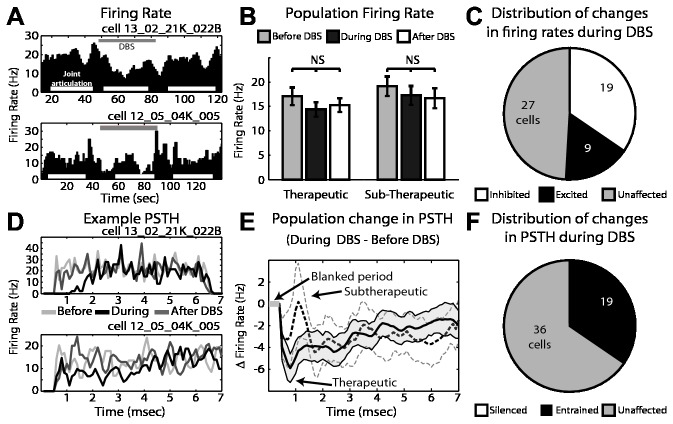
Figure 3. Cellular responses in VLo thalamus to GP-DBS during joint movement.
A: Example of firing rate in two VLo cells before, during (grey bar), and after DBS. Periods of joint articulation used for analysis are denoted by white bars. B: Population average firing rate change during therapeutic and sub-therapeutic DBS. Error bars indicate +/- 1 SEM (n=55 therapeutic DBS, n=40 sub-therapeutic DBS). C: Proportion of recorded cells with statistically significant changes in firing rate during therapeutic DBS. D: Corresponding PSTHs to the example VLo neurons shown in part A, before (light grey), during (black) and after DBS (dark grey). E: Population average change in firing pattern during therapeutic (dark grey) and subtherapeutic (light grey - dashed) DBS. Filled areas indicate +/- 1 SEM. F: Proportion of recorded cells with statistically significant changes in their PSTHs during therapeutic DBS.

