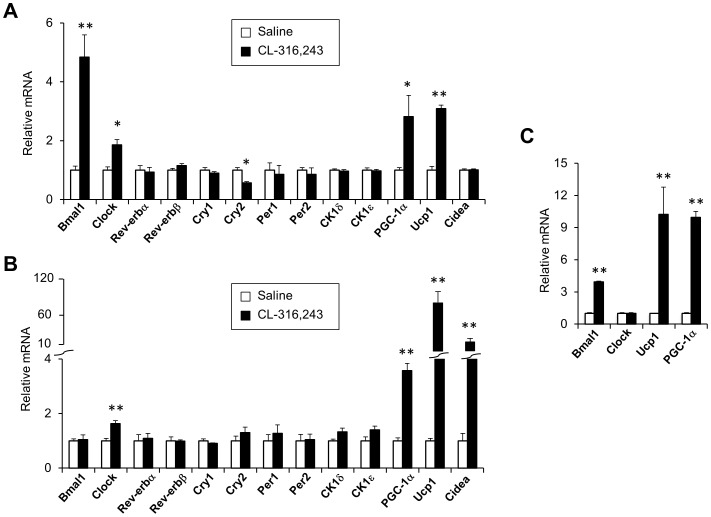
Figure 3. Regulation of clock genes by adrenergic signaling.
Three-month old male mice were injected daily with saline (n = 4, open) or CL-316,243 (n = 4, filled) for 7 days. qPCR analyses of gene expression in BAT (A) and WAT (B). Data represent mean ± SEM, saline vs. CL-316,243, *p<0.05, **p<0.01. C. qPCR analysis of gene expression in brown adipocytes 7 days after differentiation. Cells were treated with vehicle (open) or 1 µM norepinephrine (NE, filled) for 5 hrs. Data are collected from three replicates and represent mean ± stdev, vehicle vs. NE, **p<0.01.

