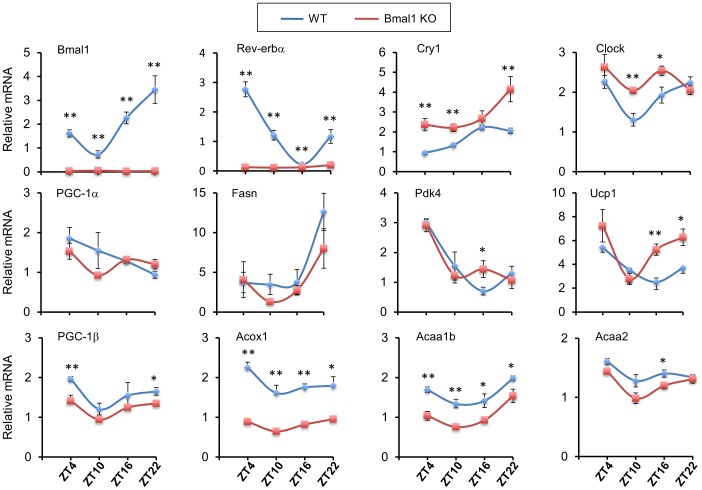
Figure 6. Circadian regulation of BAT gene expression.
BAT from WT and Bmal1 KO mice were collected at ZT4, 10, 16, and 22 (Zeitgeber time 0 is defined as the onset of subjective light phase; n = 4–6 mice for each data point per group). Total RNA was isolated for qPCR analyses of clock and metabolic gene expression. Data represent mean ± SEM. WT vs. KO, *p<0.05, **p<0.01.

