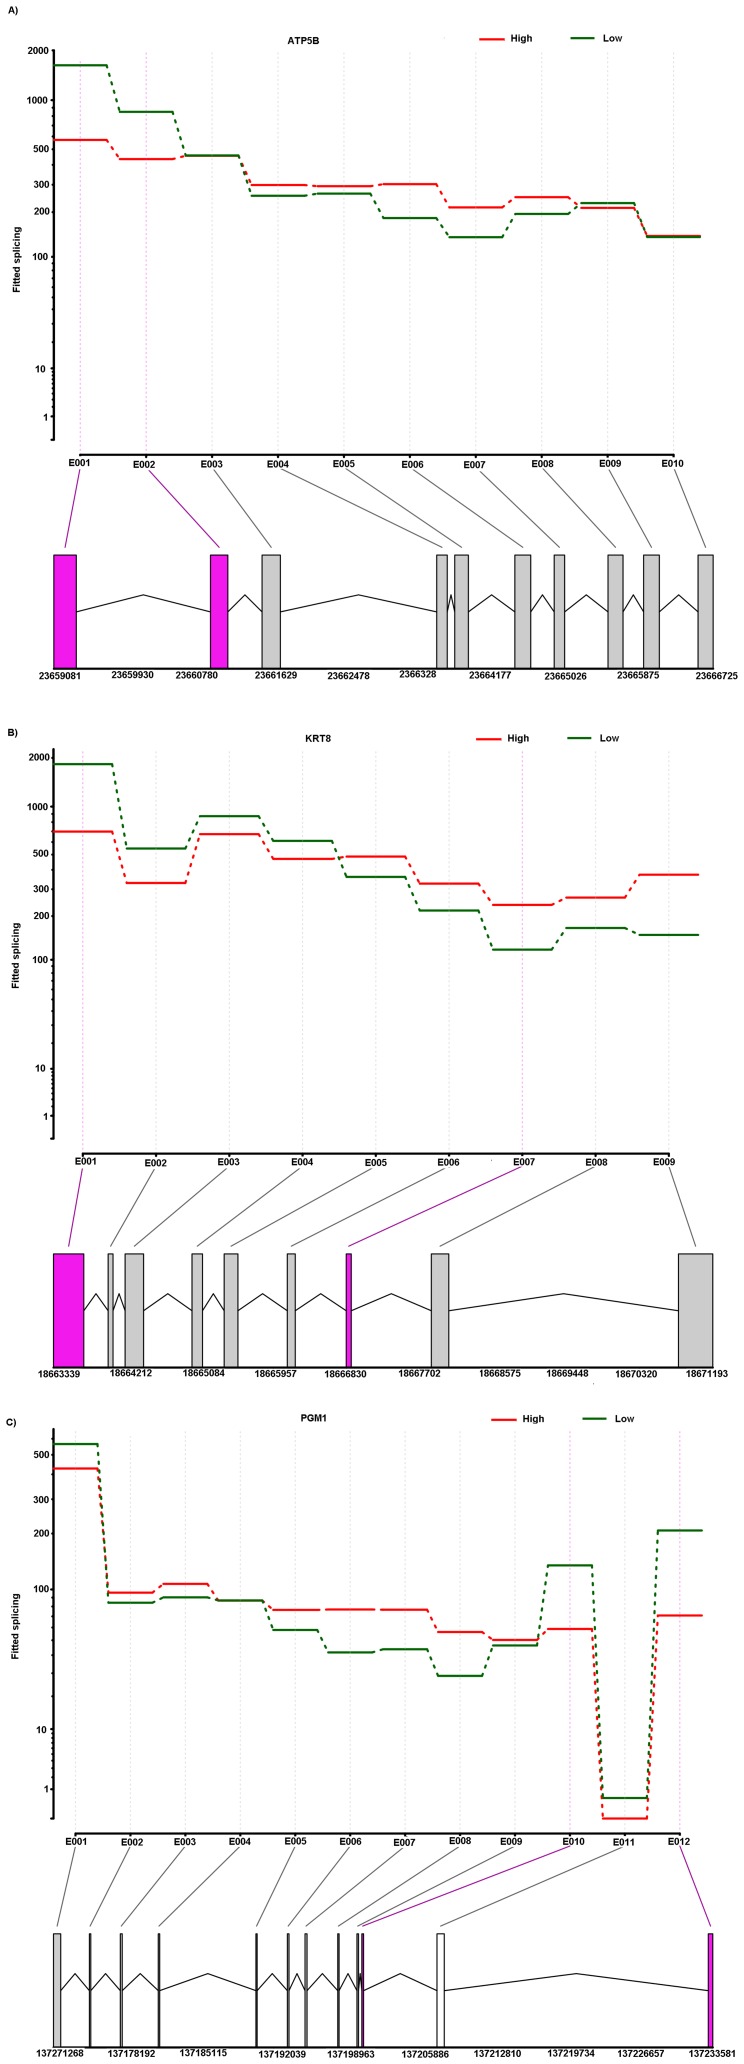
Figure 6. The schematic diagram of differential exon expression in selected genes.
Differential exon expression in ATP5B (A). KRT8 (B) and PGM1(C). (Top panel) Fitted values according to the linear model; (middle panel) normalized counts for each sample; (bottom panel) flattened gene model. (Red) Data for high skatole samples; (green) low skatole.

