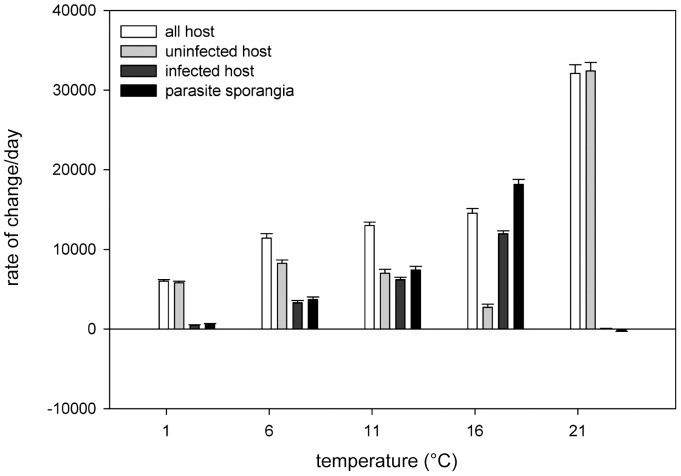
Figure 2. Thermal tolerance ranges of aggregated, species-level measures of host and parasite productivity across temperature environments.
This plot shows overall thermal reaction norms of exposed, but uninfected (light grey) and exposed, infected (dark grey) host (expressed as a rate of change day–1 in Asterionella cells) separately and combined (no colour), as well as the thermal reaction norm of the parasite (as rate of change day–1 of chytrid sporangia, black bars) in experimental units. The thermal tolerance range of the tested parasite genotype is narrower than that of the host as the parasite population shows low or no growth at both temperature extremes while the host population is still productive.

