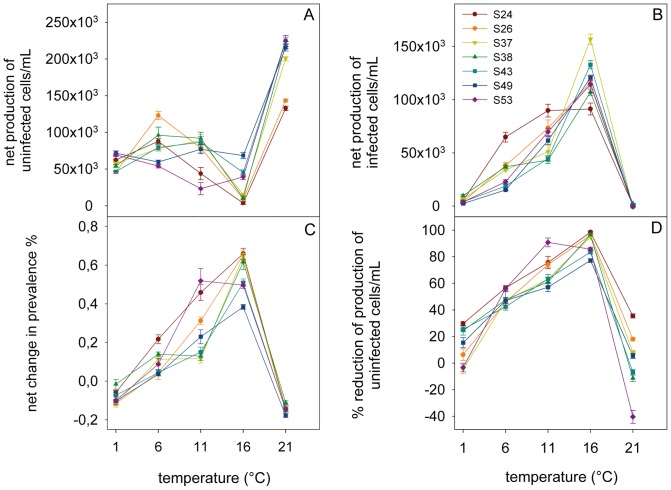
Figure 3. Genotype specific thermal reaction norms.
Observed net production of A) exposed, but uninfected host cells mL–1, B) exposed, infected host cells mL–1, C) net change in prevalence of infection, and D) % reduction of the production of uninfected cells mL–1 in parasite exposed cultures, plotted as host genotype-specific thermal reaction norms. Note the changes in host genotype performance ranking order across temperatures. Such changes indicate the potential for genotype-by-temperature interactions.

