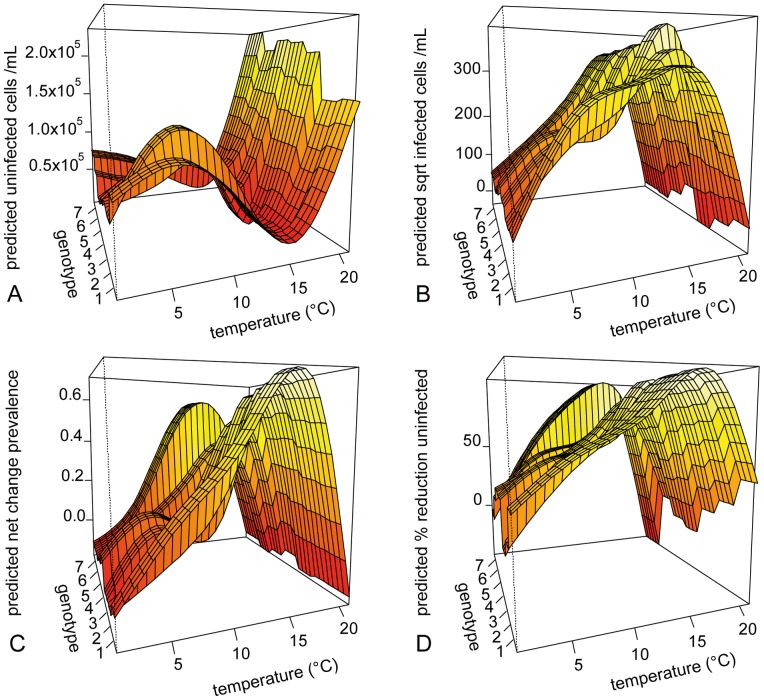
Figure 4. Visualisation of the GAM predictions for the measured response variables.
The plots show production of A) exposed, but uninfected cells mL–1, B) sqrt transformed exposed, infected cells mL–1, C) of net change in prevalence of infection, and D) % reduction of the production of uninfected cells mL–1 in parasite exposed cultures.

