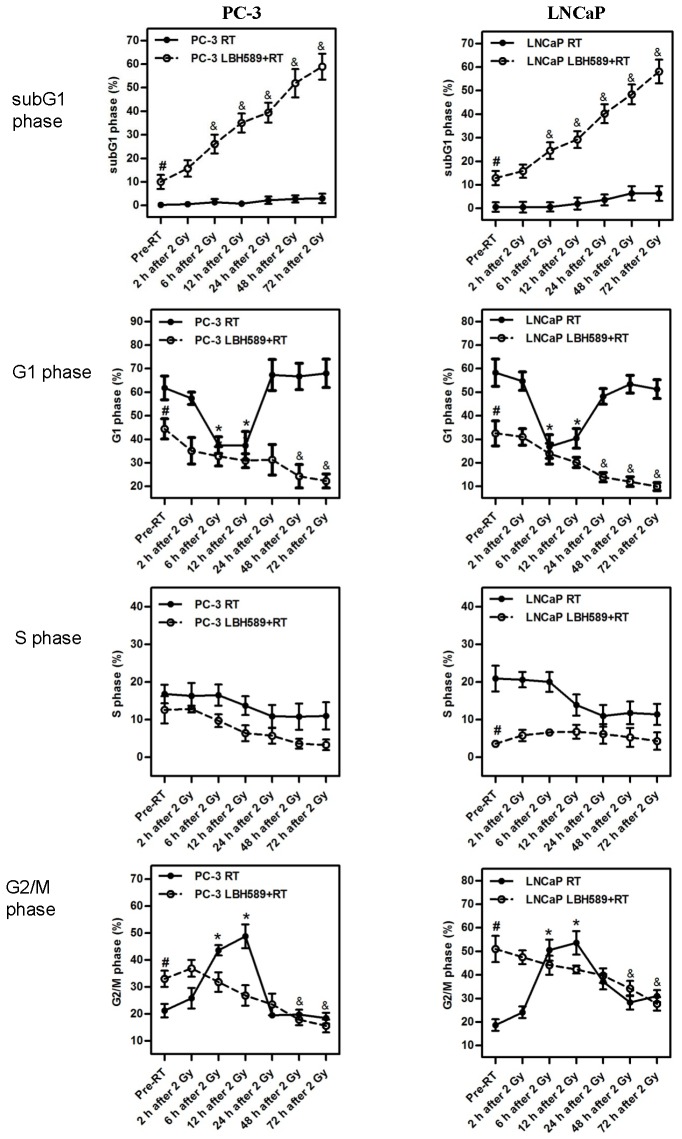
Figure 2. Effects of RT or combination treatment (LBH589 and RT) on cell cycle arrest in PC-3 and LNCaP CaP cell lines.
The percentage of subs G1, G1, S, and G2/M populations were analysed using flow cytometry from pre-RT to 72 h post-RT; p<0.01(*): significant difference in the percentage of cell cycle phase between the indicated time point and the “Pre-RT” time point in RT groups; p<0.01(#): significant difference in the percentage of cell cycle phase between the RT group and the combination group at the “Pre-RT” time point; p< 0.01(&): significant difference in the percentage of cell cycle phase between the indicated time point and the “Pre-RT” time point in combination group. All results were from three independent experiments (N=3). Points, mean; bars, SD.

