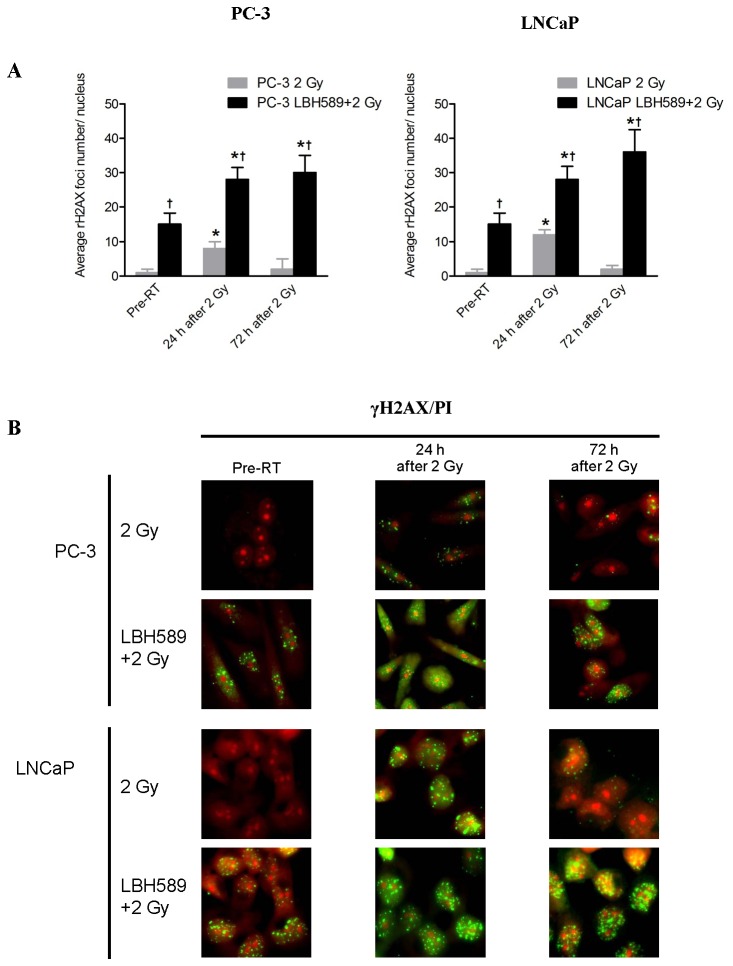
Figure 4. Quantitative analysis of DNA double strand break (DSB) marker γH2AX foci at pre-RT, 24 h and 72 h after 2 Gy RT or combination treatment in PC-3 and LNCaP cells.
(A) After 2 Gy RT, average γH2AX foci number increased significantly at 24 h in both PC-3 and LNCaP cells and decreased to a lower level at 72 h while average γH2AX foci number in combination-treated (LBH589+2 Gy RT) cells was significantly higher than that in RT-treated cells at any time points and continued to increase until 72 h. (B) Representative images of γH2AX staining after 2 Gy RT or combination treatment (LBH589+2 Gy RT) in PC-3 and LNCaP cells. p<0.05(†) indicates significant difference between RT-treated cells and combination-treated cells at the same time point. p<0.05(*) indicates significant difference between cells at specific time points and cells receiving the same treatment at the “Pre-RT” time point. Points, mean; bars, SD. N=50. Typical images are shown from three independent experiments (N=3). Magnification × 60 in all images.

