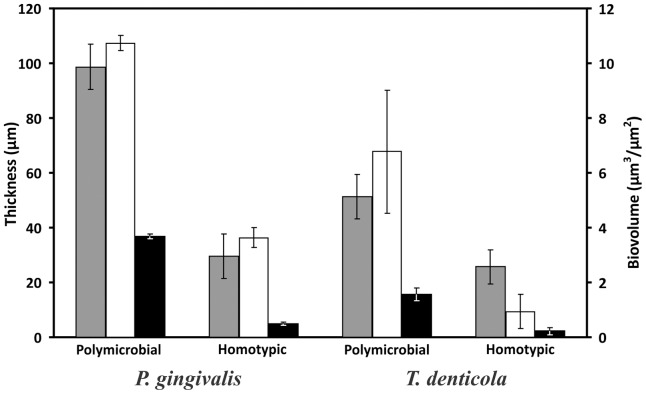
Figure 2. Synergistic P. gingivalis and T. denticola biofilm formation.
Both polymicrobial and homotypic biofilms were produced using a flow cell under identical conditions. The two sets of bars above the species name refer to the biometric parameters measured using the species-specific fluorescent probe for the species grown either as part of the polymicrobial biofilm or as a homotypic biofilm. The primary vertical axis (left) is for maximum (grey bars) and average (black bars) biofilm thickness (μm) and the secondary vertical axis (right) is for biovolume (white bars) (μm3/μm2). Data are expressed as means ± standard deviations of five CLSM images at random positions from biological replicates. All images were analysed using COMSTAT software.

