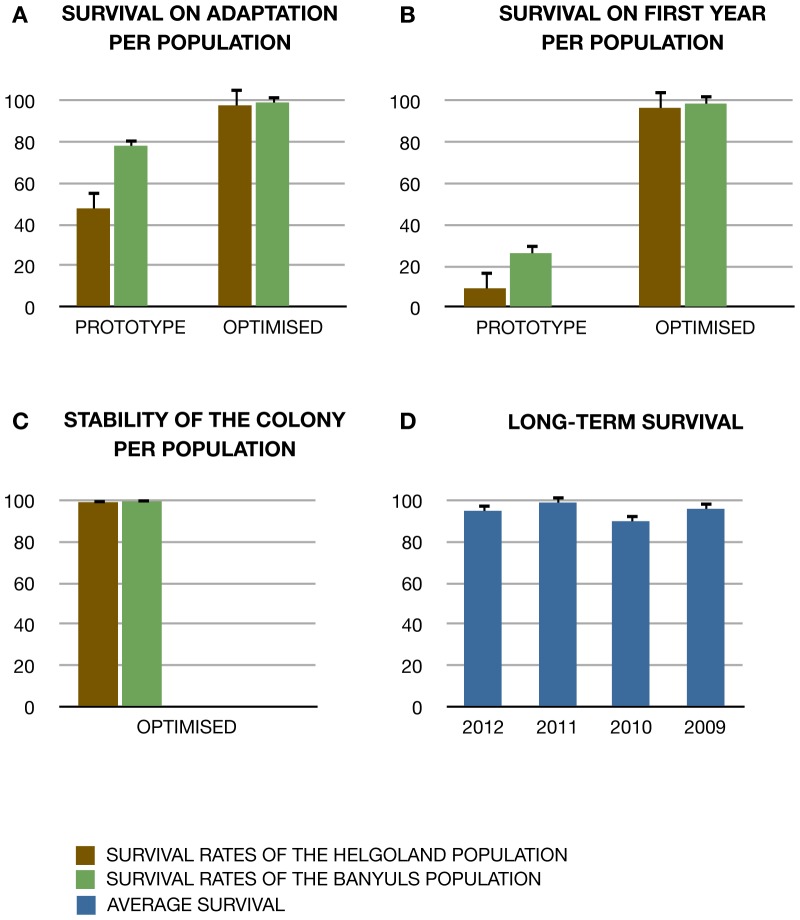
Figure 2. Long-term survival and stability of amphioxus colonies.
(A) Survival rates during the first month of farming in the laboratory per population in “prototype” and “optimized” setups. (B) Survival rates during the first year of farming in the laboratory per population in the two culturing setups. (C) Survival of the different amphioxus populations in our optimised facility over 4 years of farming. (D) Average survival rates in 2012 of animals that were farmed for several years, meaning they were collected in 2012, 2011, 2010 or 2009. Confidence intervals on the binomial probabilities were generated using the R package “binom” with the exact method.

