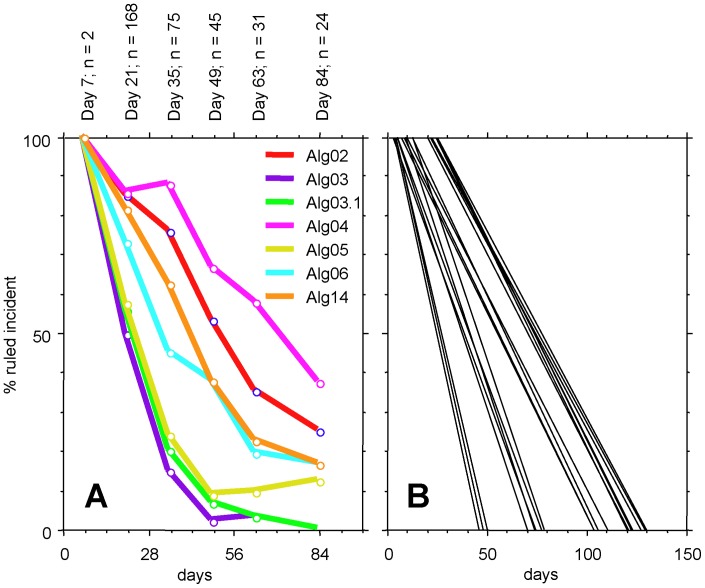
Figure 1. Percentage of cases ruled incident in dependence of time.
A. Curves of selected representative algorithms. For algorithm definitions refer to Supporting Information 1. Text on top of the panel denotes the interval midpoints and the number of cases in each interval. B. Linear regression curves of all algorithms except Alg10.

