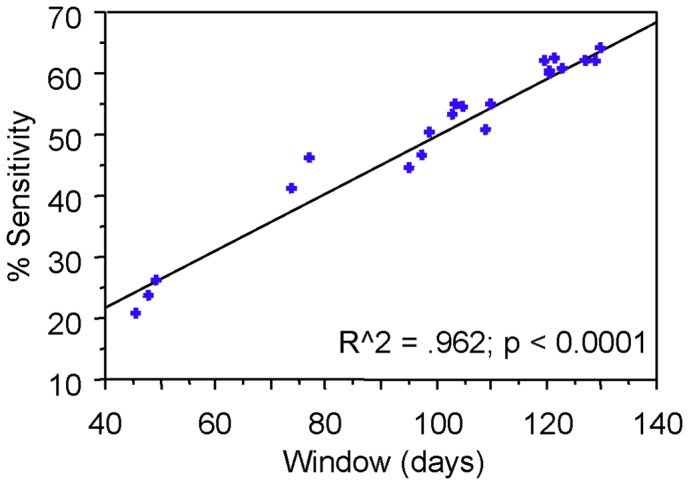
Figure 2. Correlation of window length and diagnostic sensitivity of the algorithms.

The diagnostic sensitivity data represent the uncorrected raw sensitivity S0, as determined in [19].

The diagnostic sensitivity data represent the uncorrected raw sensitivity S0, as determined in [19].