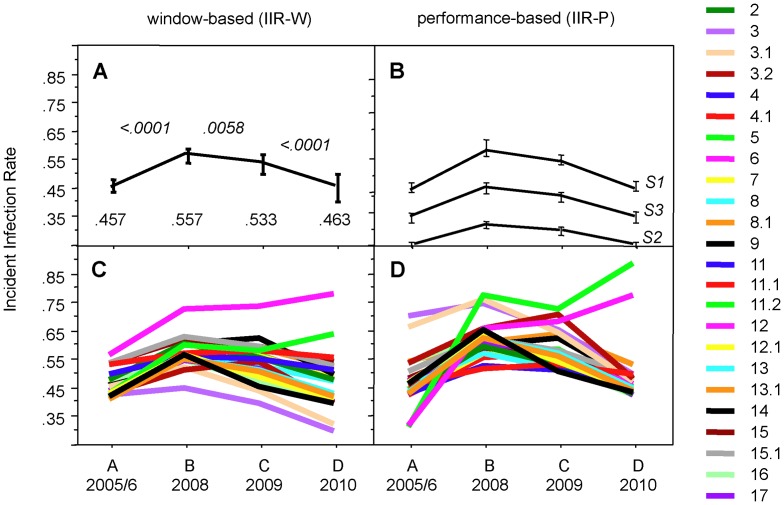
Figure 3. Comparison of window-based and performance-based incident infection rates (IIR) in four annual cohorts of HIV-1 notifications.
A) Mean IIR-W and their 95% confidence intervals (CI) of the 25 algorithms of Table 3. The numbers at the bottom of the panel indicate the means of the IIR, numbers in italics on top of the curves denote the P values for the differences according to t-test. B) Mean IIR-P and their 95% CI derived from the 10 best-performing algorithms (Algs 4.1, 7, 8.1, 9, 11.1, 11.2, 12.1, 13, 15, 15.1), as determined in [19]. Shown are the IIR-P curves of three models calculated with diagnostic sensitivities S1, S2, and S3, as defined under Methods; see also Supporting Material S3. C) Individual IIR-W of all 25 algorithms. D) Individual IIR-P of all 25 algorithms based on the diagnostic sensitivities S1.

