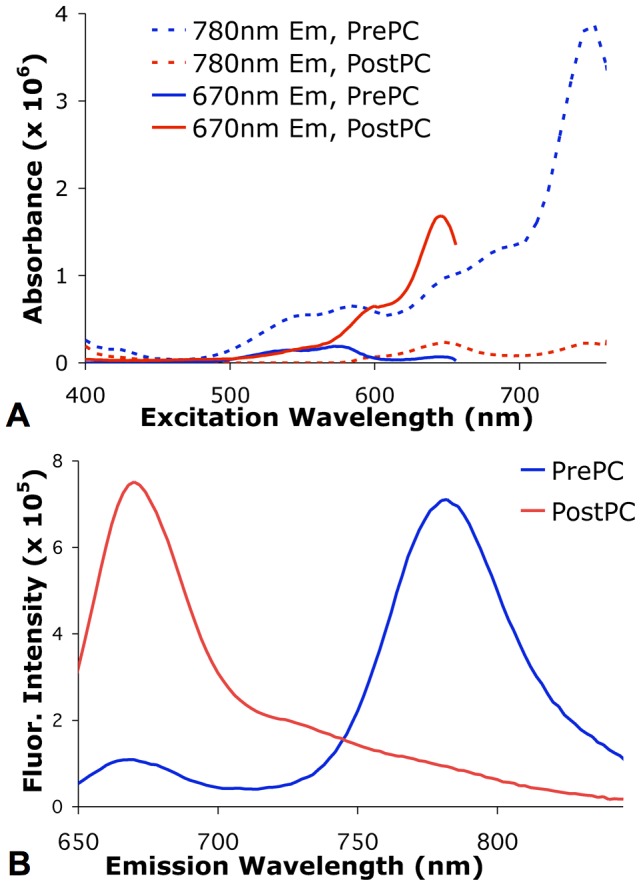
Figure 2. DiR dye spectra before and after photoconversion.

(A) Fluorescence excitation spectra of DiR-labeled cells before (PrePC) and after (PostPC) photoconversion acquired at 670 nm and 780 nm emission. (B) Fluorescence emission spectra of DiR-labeled cells before (PrePC) and after (PostPC) photoconversion when excited at 632 nm, showing a significant shift in the fluorescence peak from 780 nm to 670 nm following photoconversion.
