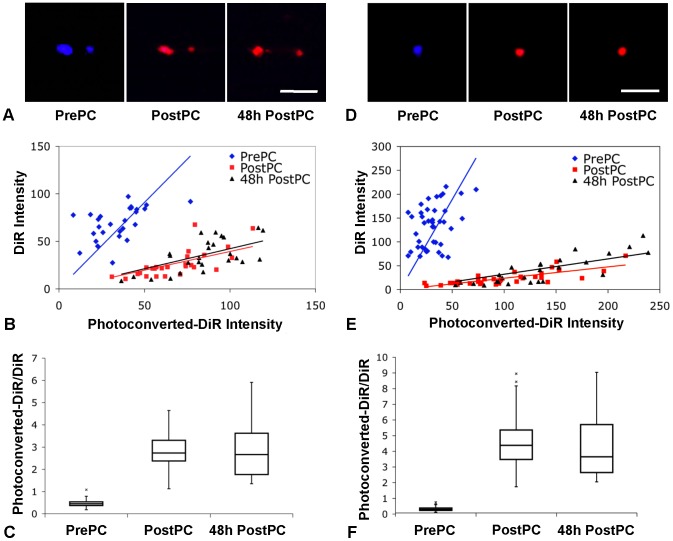
Figure 4. In vivo photoconversion of DiR-labeled cells.
(A) In vivo fluorescence confocal images of DiR-labeled HSPCs acquired before (PrePC), immediately after (PostPC), and 48 h after (48 h PostPC) photoconversion within the skull BM of a live mouse (blue: DiR, >770 nm; red: photoconverted-DiR, 670–720 nm). Scale bar: 50 µm. (B) Plot of fluorescence intensity of in vivo HSPCs before (PrePC), immediately after (PostPC), and 48 h after (48 h PostPC) photoconversion for each individual cell. (C) Boxplot of the ratios of the photoconverted-DiR intensity to the DiR intensity, showing ability to photoconvert cells within the skull BM of live mice and to distinguish the change in the fluorescence intensity ratio after photoconversion (ppre-post = 7.72×10⁻¹⁴) as well as show the stability of the photoconversion in vivo over time (ppost-48hpost = 0.82). (D) In vivo fluorescence confocal images of DiR-labeled T cells acquired before (PrePC), immediately after (PostPC), and 48 h after (48 h PostPC) photoconversion within the skull BM of a live mouse (blue: DiR, >770 nm; red: photoconverted-DiR, 670–720 nm). Scale bar: 50 µm. (E) Plot of fluorescence intensity of in vivo T cells before (PrePC), immediately after (PostPC), and 48 h after (48 h PostPC) photoconversion. (F) Boxplot of the fluorescence intensity ratios showing ability to distinguish the change in fluorescence after photoconversion (ppre-post = 2.59×10⁻¹⁶) as well as show the stability of the photoconversion in vivo over time (ppost-48hpost = 0.94).

