
Figure 5. In vivo tracking of hematopoietic stem/progenitor cell proliferation.
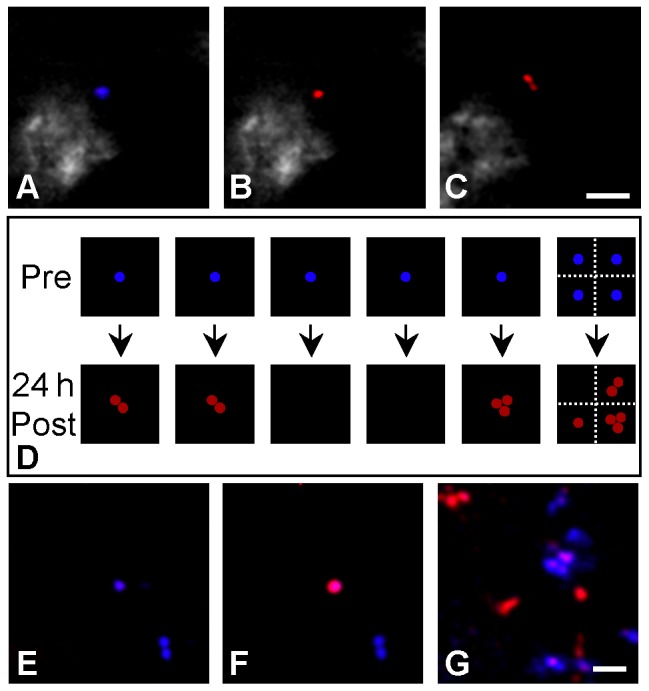
Fluorescence confocal images of DiR-labeled HSPCs acquired in the skull BM of mice (A) before, (B) immediately after, and (C) 24 h after in vivo photoconversion (blue: DiR, >770 nm; red: photoconverted-DiR, 670–720 nm). Image (C) shows proliferation of the photoconverted cell. The drawing in figure (D) represents the results of tracking nine cells 24 h after photoconversion in six mice; each square represents one mouse. Series (E)–(G) demonstrates the ability to track HSPCs over long, discontinuous time periods by showing images acquired within the skull bone marrow (E) before, (F) immediately after, and (G) 135 h after in vivo photoconversion (blue: DiR, >770 nm; red: photoconverted-DiR, 670–720 nm). Scale bars: 50 µm.