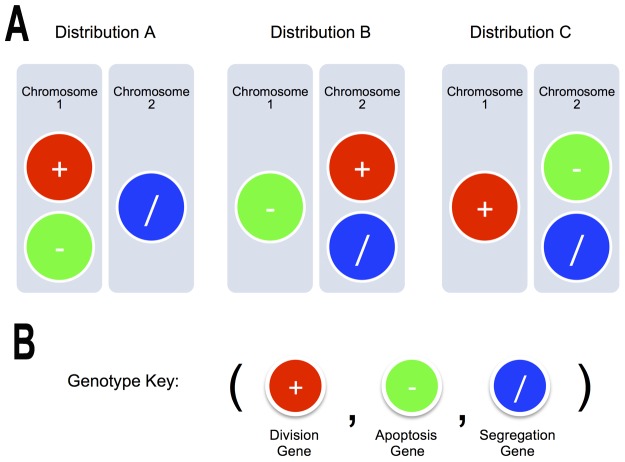
Figure 1. Genotype configurations and Gene Key.
A. The different Gene Abstractions were placed into chromosomes in three different configurations. This led to different kinds of linkages between the Genes. B. For the notation of different genotypes, we have used the following key: (Number of Division Genes, Number of Death Genes, Number of Segregation Genes). The initial Genotype in every simulation is a diploid genome: (2,2,2). To better understand the proportions of the genes in a given phenotype, we have used the RGB model to represent the number of division genes as red, the number of death genes as green and the number of segregation genes as blue See Methods, Genotype Key).

