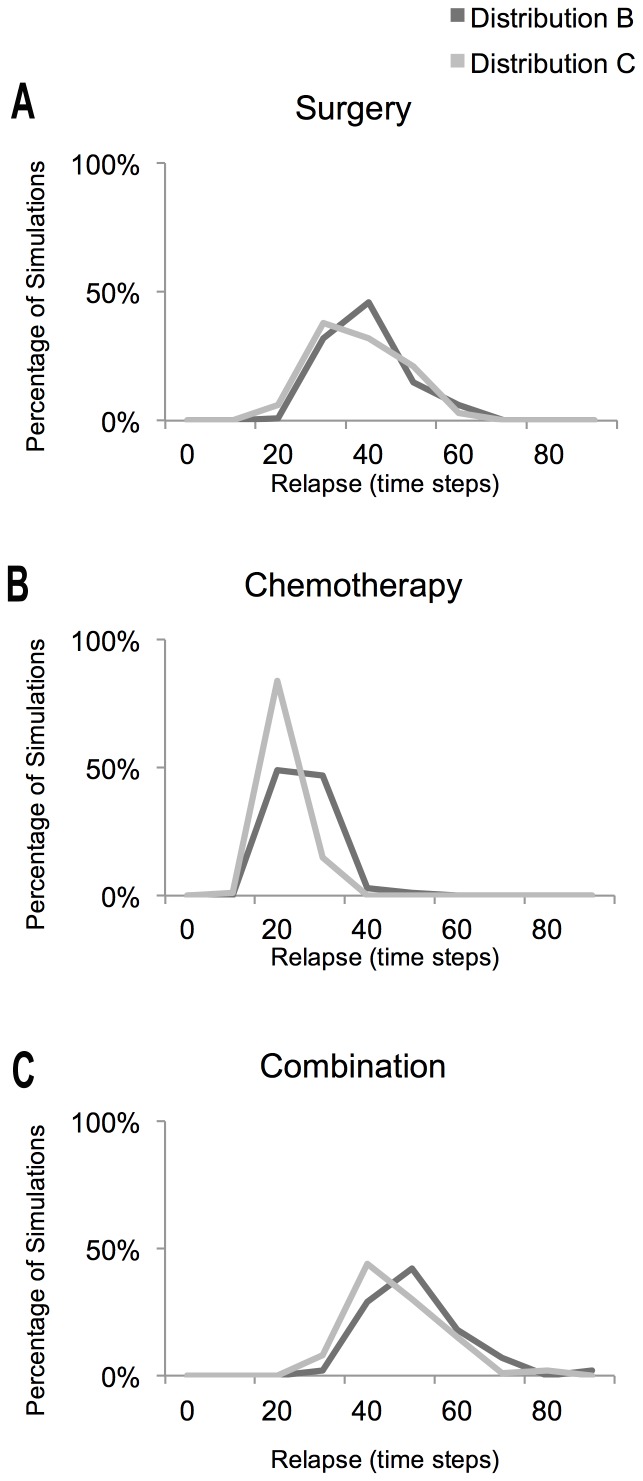
Figure 4. Distribution of the response to treatments under different scenarios.
The histograms correspond to a measure of the distribution of the relapse times (the time it took each simulation to grow back to 1000 cells after treatment) for 100 simulations of each gene configuration under three different therapy scenarios: A. Surgery Scenario, B. Chemotherapy Scenario and C. Combination of both treatments (Surgery followed by Chemotherapy).

