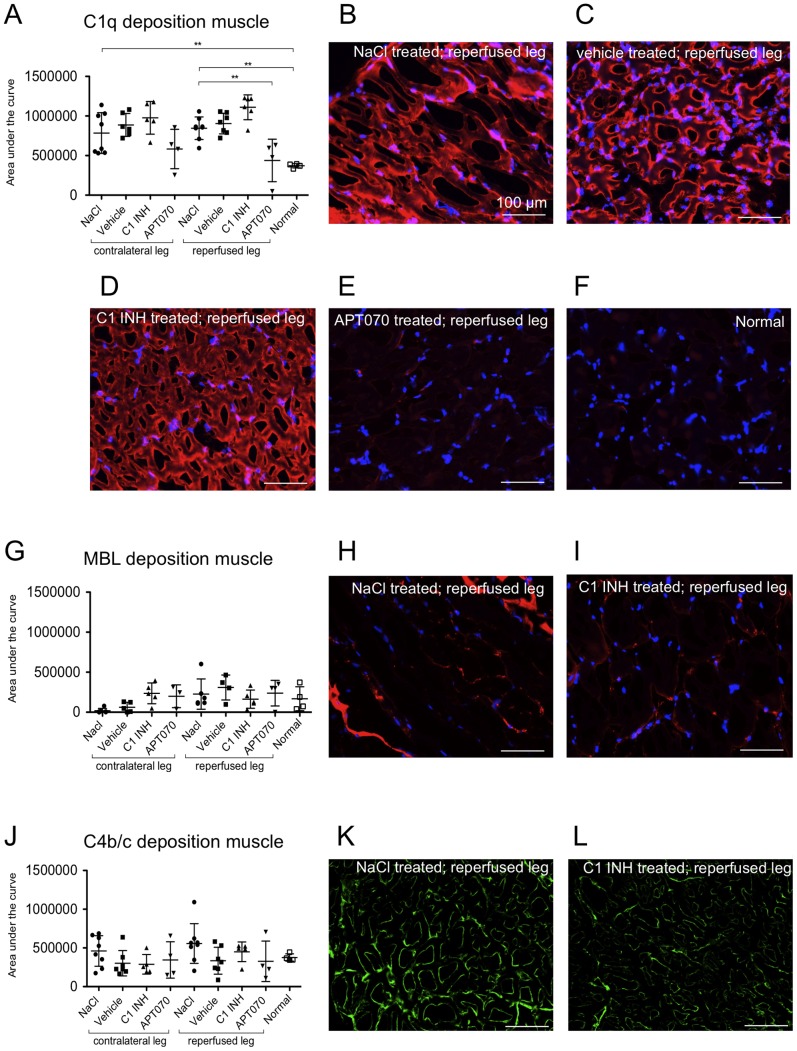
Figure 4. Deposition of C1q, MBL and C4b/c in muscle tissue.
(A, G and J) Quantification data of C1q, MBL and C4b/c deposition in muscle tissue. (B–F) Representative immunofluorescence images of C1q deposition depending on treatment. (H and I) Representative immunofluorescence images of MBL deposition in muscle tissue. Counterstaining with DAPI (blue channel), C1q or MBL visible in the red channel (CY3). (K and L) Representative immunofluorescence images of C4b/c in muscle tissue, C4b/c visible in the green channel (Alexa 488). One-way ANOVA followed by Dunnett's post hoc test for significance vs. NaCl controls was used. Error bars indicate mean ± SD. *P<0.05; **P<0.01; ***P<0.001.

