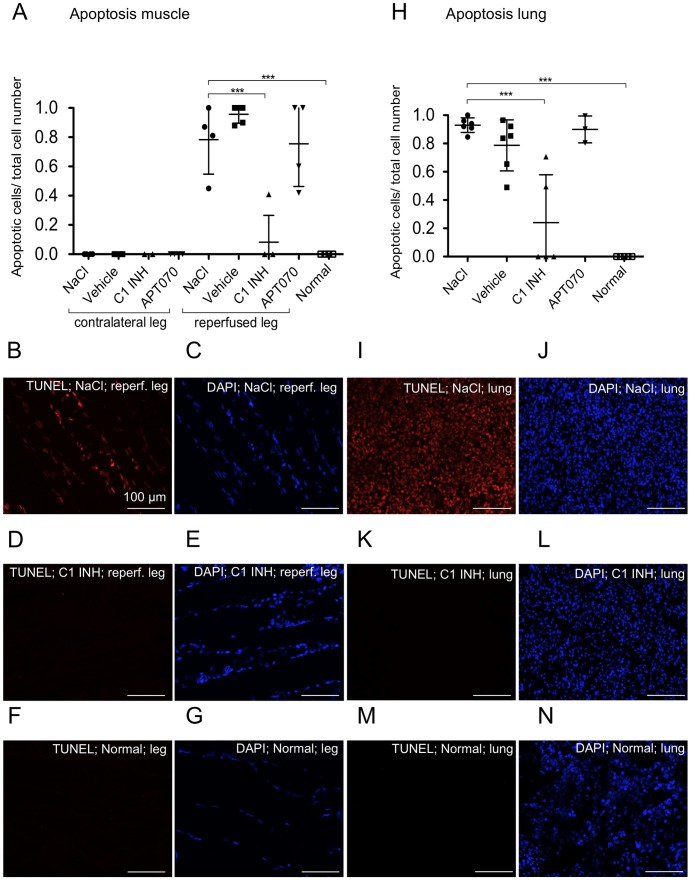
Figure 6. Frequency of apoptotic cells in muscle and lung tissue.
(A and H) Quantitative analysis of TUNEL staining in muscle and lung tissue, respectively. (B–G) and (I–N) Representative immunofluorescence images of TUNEL staining of reperfused muscle and lung, respectively. TUNEL-positive cells are shown in red (B, D, F, I, K, M), corresponding DAPI staining of all nuclei in blue (C, E, G, J, L, N). One-way ANOVA followed by Dunnett's post hoc test for significance vs. NaCl controls was used. Error bars indicate mean ± SD. *P<0.05; **P<0.01; ***P<0.001.

