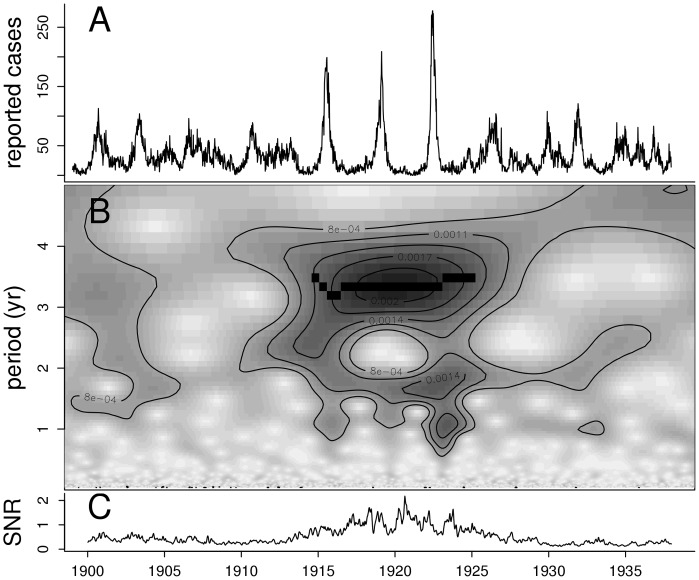
Figure 1. Time series of reported pertussis cases in Copenhagen (A), wavelet decomposition of the square-root transformed reports (B), and the signal-to-noise ratio (C).
Darker areas of the wavelet plot indicate stronger support for cycles of the period identified on the middle left axis. The black band shows the region with strong cycles as identified by the ridge-finding algorithm.

