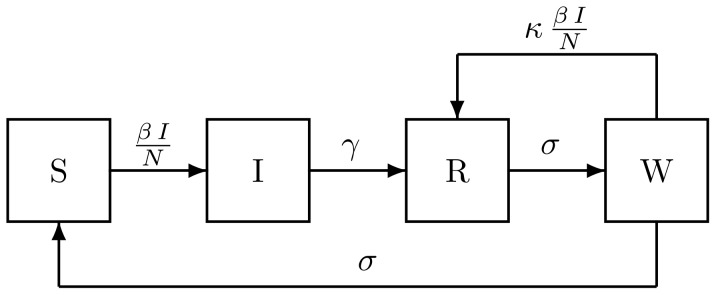
Figure 2. Flow diagram for the models, showing rates of flow among compartments containing individuals who are susceptible to pertussis (S), infected and infectious (I), recovered and immune (R), and susceptible to boosting because their immunity is waning (W).

When  and
and  , immunity wanes and is boosted by re-exposure; we term this the SIRWS model. When
  and
and  , immunity wanes passively; we term this the SIRS model. In this model, the duration of immunity is gamma-distributed with mean
  and variance
  . When
  and
and  , immunity is permanent; this is the SIR model.
