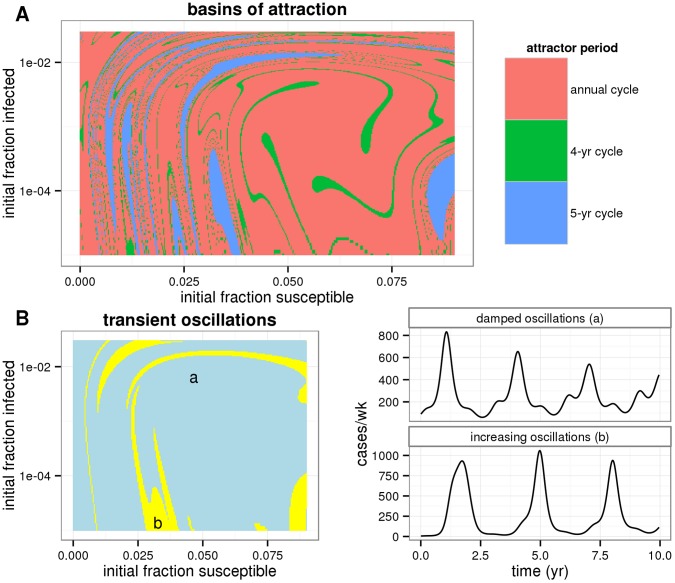
Figure 4. Basins of attraction and undamped transients.
(A) The basins of attraction were computed using the maximum-likelihood estimates of parameters, but with a low birth rate of  /yr. Blue corresponds to a 5-yr cycle, green to a 4-yr cycle, and pink to the annual attractor. (B) Simulations from the same model and parameters but with a realistic birth rate of
  /yr. Initial conditions that lead to oscillations with transiently increasing amplitude are indicated in yellow; blue indicates oscillations of steadily decreasing amplitude. Two example time series (from points labeled `a’ and `b’ are shown at right.

