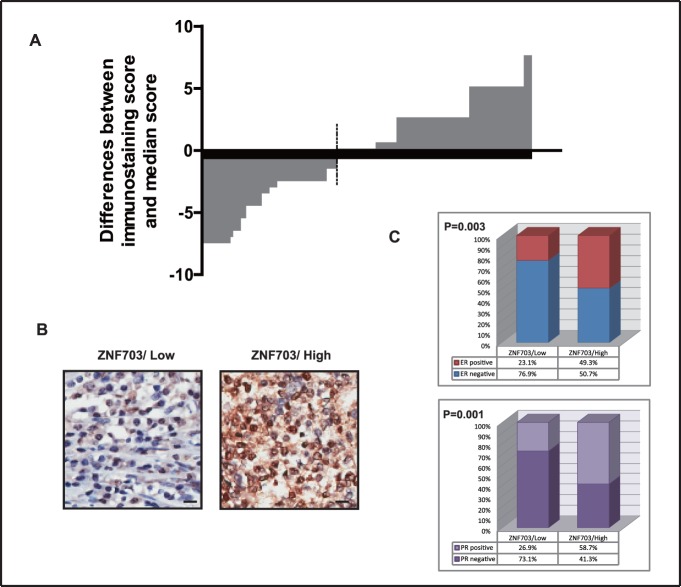
Figure 1. IHC staining of ZNF703 in 127 cases of breast cancer tissue microarrays.
(A) Immunohistochemistry (IHC) scoring of ZNF703 in 127 breast cancer patients. The vertical axis indicates the difference between the score of each patient and the median score. The dotted line represents the cut-off point by which patients were divided into high and low ZNF703 expression groups. (B) Representative image of IHC staining for ZNF703 in breast cancer specimens. Left: low ZNF703 expression; Right: high ZNF703 expression. The bar represents 10 µm. (C) High ZNF703 expression was mainly present in ER+ and PR+ breast cancers. Left: proportion of patients with ER+ or ER− breast cancer in the high or low ZNF703 expression groups, respectively. Right: proportion of patients with PR+ or PR− breast cancer in the high or low ZNF703 expression groups, respectively. Also see Table S1.

