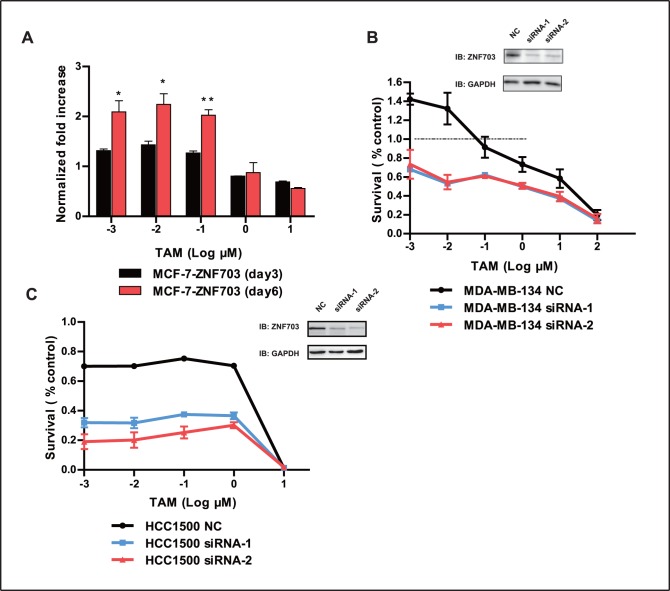
Figure 4. Increasing effects of TAM in MDA-MB-134 and HCC1500 cells after ZNF703 knockdown.
(A) MCF-7-ZNF703 cells were treated with DMSO or different concentrations of TAM for 3 or 6 days, and the optical density (OD) was measured by the SRB assay. The y-axis represents the ratio of OD in TAM-treated cells compared to DMSO-treated cells. (B) Western blot analysis of ZNF703 and GAPDH in MDA-MB-134 non-targeting siRNA control (NC), MDA-MB-134 siRNA-1 or MDA-MB-134 siRNA-2 cells. Cells were treated with DMSO or different concentration of TAM for 6 days, and survival rates were examined. MDA-MB-134 NC vs. MDA-MB-134 siRNA-1 cells, P<0.05; MDA-MB-134 NC vs. MDA-MB-134 siRNA-2 cells, P<0.05; MDA-MB-134 siRNA-1 vs. MDA-MB-134 siRNA-2 cells, P>0.05. Statistical analyses were done by paired t-test. (C) Western blot analysis of ZNF703 and GAPDH in HCC1500 NC, HCC1500 siRNA-1, and HCC1500 siRNA-2 cells. Cells were treated with DMSO or different concentrations of TAM for 6 days, and survival rates were examined. HCC1500 NC vs. HCC1500 siRNA-1 cells, P<0.05; HCC1500 NC vs. HCC1500 siRNA-2 cells, P<0.05; HCC1500 siRNA-1 vs. HCC1500 siRNA-2 cells, P<0.05. Data is representative of at least three independent experiments and are presented as mean ± SD. *P<0.05, **P<0.01.

