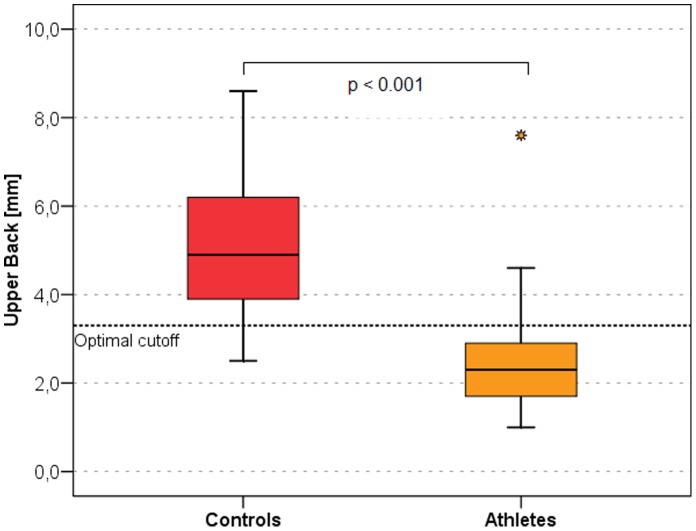
Figure 4. Box plots of the upper back measurement site in athletes and controls.
This is the body site with the highest discriminating power in women. The black horizontal lines represent the median, the box represents the 1st and 3rd quartile, the whiskers the 5th and 95th percentiles. Outliers are represented by dots. Optimal cutoff is marked by a dotted horizontal line.

