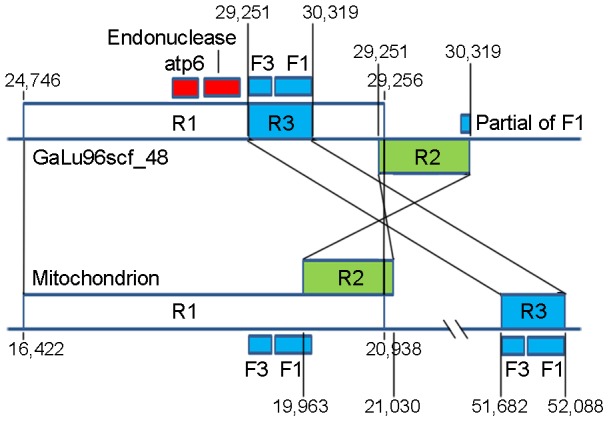
Figure 2. Similarity analysis of sequences between mtDNA and nuclear DNA.

The top sequence represents the scaffold 48 from the nuclear genome assembly galu96 and the bottom sequence represents the mitochondrion. The homologous regions can be classified into three regions, namely, R1 (white box), R2 (green box), and R3 (blue box), which are connected with black lines at both ends of the corresponding fragments. The coordinates showing the start and end of each region are also shown. F1 and F3 represent two forward repeats. Endonuclease gene and atp6 are also indicated (red box) in GaLu96_scf48.
