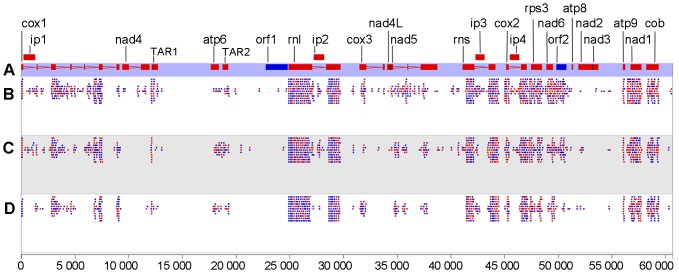
Figure 3. Mitochondrial transcriptome of Ganoderma lucidum in three differential developmental stages.
Red and blue colors indicate that the genes or reads are on the forward and reverse strands, respectively. (A) Genome organization of G. lucidum mitochondria. The intron and exon structures of genes, as well as the names of genes, are shown. Two TAR regions, namely, TAR1 and TAR2, are shown. The mapping of RNA-Seq reads from mycelia (B), primordia (C), and fruiting bodies (D) is also shown. The nucleotide coordinates are shown at the very bottom of the figure.

