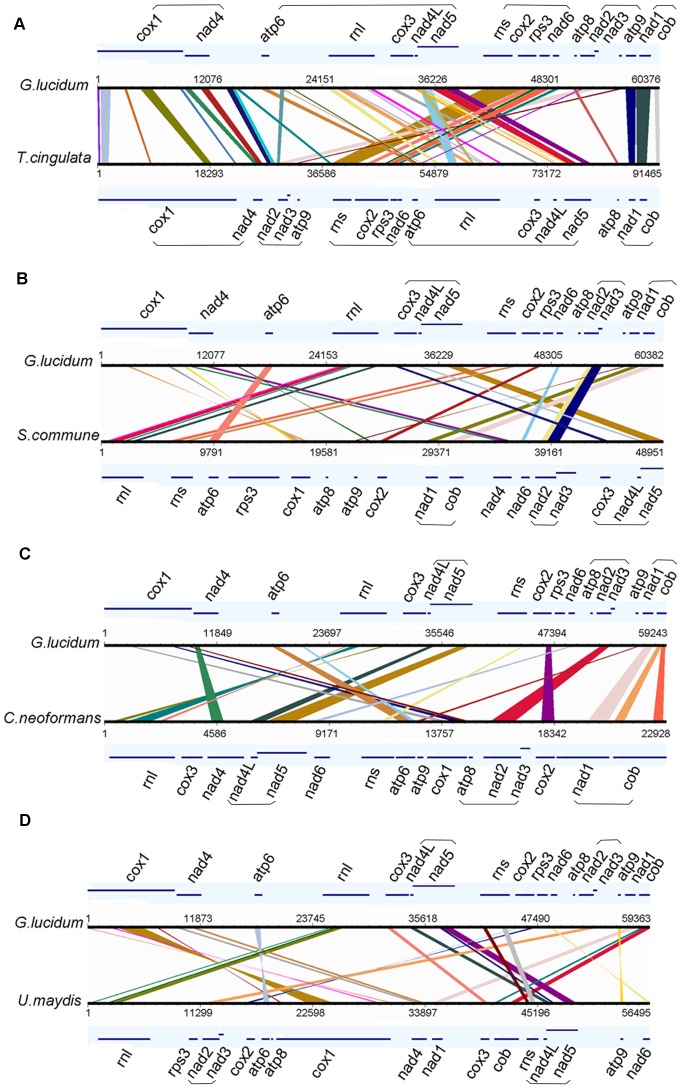
Figure 6. Synteny analysis of mitochondrial genomes.
Synteny comparison of genomes between Ganoderma lucidum and Trametes cingulata (A), Schizophyllum commune (B), Cryptococcus neoformans (C), and Ustilago maydis (D). The genes are represented with lines, and their names are shown next to the corresponding lines. The conserved gene blocks are highlighted with parentheses. The conserved regions are bridged by lines. Genome synteny visualization was performed by GSV, a web-based genome synteny viewer. Co-rearrangement genes are underlined.

