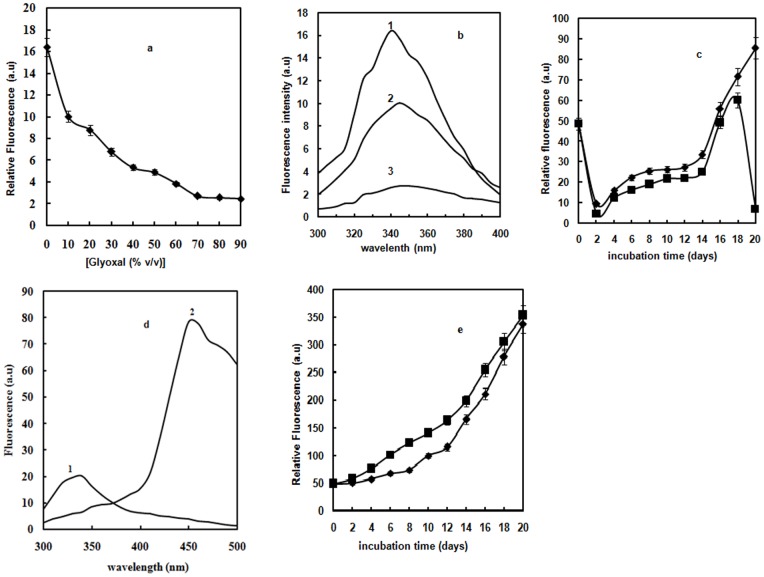
Figure 1. Fluorescence studies.
(a) Relative fluorescence of Hb as a function of glyoxal [♦]. Error bars represent the mean ± SD (n = 3). *Significance p<0.05 with respect to control. (b) Intrinsic fluorescence emission spectra of Hb in the absence of glyoxal (curve 1); in the presence of 20% (curve 2) and 70% glyoxal (curve 3). (c) Relative fluorescence of Hb as a function of increasing days at 30% [♦] and 40% [▪] glyoxal excited at 280 nm at 37°C. The protein concentration was 8 µM and the path length was 1 cm. Error bars represent the mean ± SD (n = 3). *Significance p<0.05 with respect to control. (d) Intrinsic Fluorescence emission spectra of native Hb in 20 mM sodium phosphate buffer of pH 7 (curve 1) and Hb at 30% glyoxal on day 20 at 37°C (curve 2). The excitation wavelength was 280 nm and emission wavelength was in the range 300–500 nm. The protein concentration was 3 µM and the path length was 1 cm. (e) Time dependent formation of two AGEs products of Hb, excitation at 330 nm (▪) and 365 nm [♦] at 30% glyoxal at 37°C. The protein concentration was 8 µM and the path length was 1 cm. Error bars represent the mean ± SD (n = 3). *Significance p<0.05 with respect to control.

