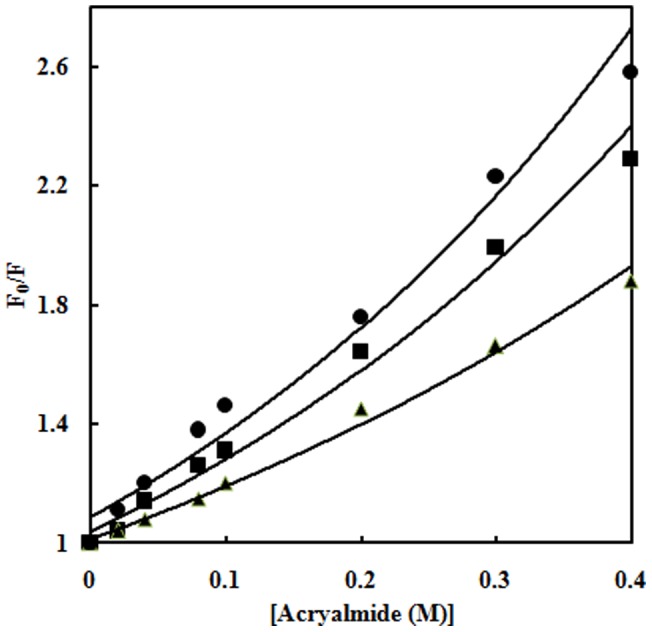
Figure 2. Acrylamide quenching.

Stern–Volmer plots for acrylamide quenching of tryptophan fluorescence of native Hb in 20 mM sodium phosphate buffer, pH 7 (▴); Hb at 20% (▪) and 70% glyoxal [•]. Values shown are the ratios of fluorescence in the absence of acrylamide (F0) to the fluorescence at that concentration of quencher (F). The excitation wavelength was 295 nm and emission wavelength was in the range 300–400 nm. The protein concentration was 3 µM and the path length was 1 cm.
