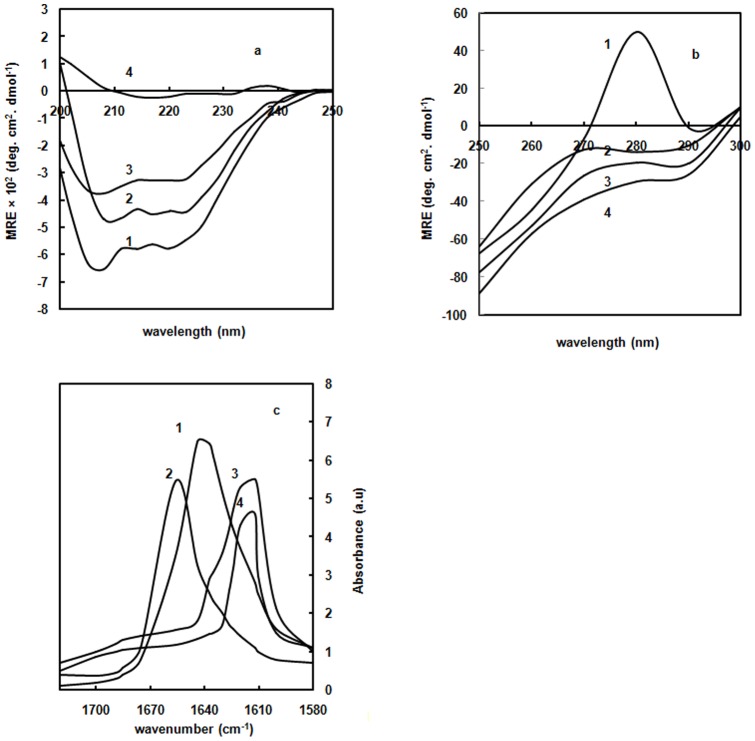
Figure 6. Secondary structure measurements.
(a) Far-UV CD spectra of native Hb in absence of glyoxal (curve 1); in the presence of 20% (curve 2); 70% glyoxal (curve 3), and 30% glyoxal on day 20 (curve 4). The far-UV CD spectra were recorded between 200 nm and 250 nm. The protein concentration was 8 µM and the path length was 0.1 cm. (b) Near-UV CD spectra of native Hb in absence of glyoxal (curve 1); in the presence of 20% (curve 2); 70% (curve 3), and 30% glyoxal on day 20 (curve 4). The near-UV CD spectra were recorded between 300 and 350 nm. The protein concentration was 15 µM and the path length was 1 cm. (c) ATR-FTIR spectra of native Hb in absence of glyoxal (curve 1); in the presence of 20% glyoxal (curve 2); 70% glyoxal (curve 3), and 30% glyoxal on day 20 (curve 4). The protein concentration was 80 µM.

