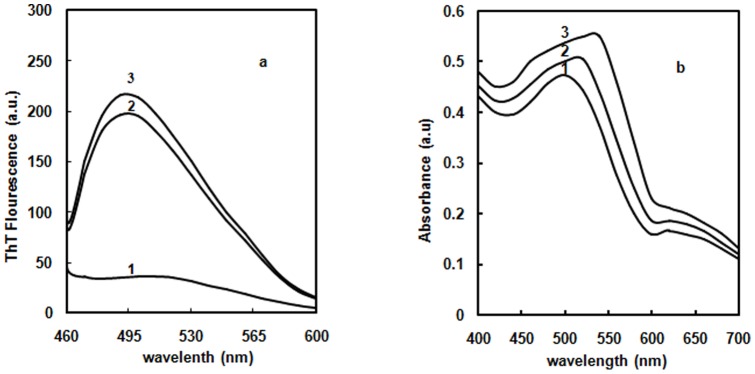
Figure 9. ThT and CR binding.

(a) ThT emission spectra of native Hb in absence of glyoxal (curve 1); in the presence of 70% glyoxal (curve 2) and 30% glyoxal on day 20 (curve 3). The path length was 1 cm, λex 440 nm and λem 460–600 nm. The protein concentration was 3 µM. (b) CR absorption spectra of native Hb in 20 mM sodium phosphate buffer (curve 1); in the presence of 70% glyoxal (curve 2) and 30% glyoxal on day 20 (curve 3). The protein concentration was 6 µM. The absorption spectra were recorded from 400–600 nm.
