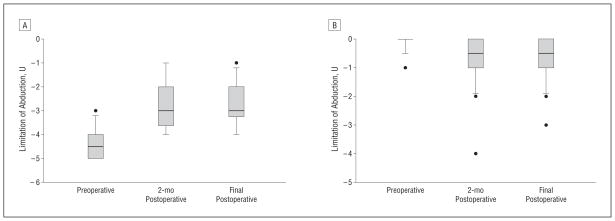
Figure 3.
Ductions before and after surgery (n=17) A) Abduction limitation; B) Adduction limitation. Final postoperative visit represents a mean follow-up of 8 months (range, 1.5 to 32 months). To prevent the measurements of one overcorrected patient from confounding postoperative averages, we re-analyzed the values after excluding that patient and found no substantive change in the calculated means or p values.[Box and whisker diagram: The bottom and top of the box represent the 25th and 75th percentile (the lower and upper quartiles, respectively); the band near the middle of the box is the 50th percentile (the median). The ends of the whiskers represent the minimum and maximum of all the data. Any data not included within the whisker is plotted as an outlier with a dot.]

