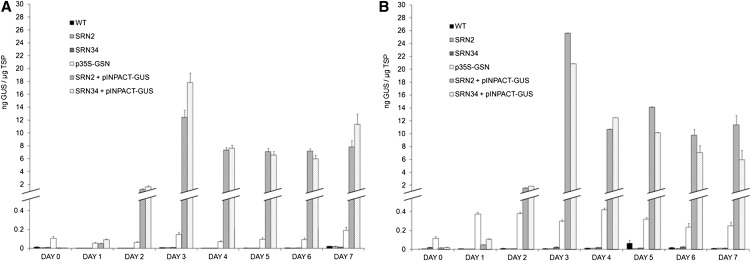
Figure 5.
Quantification of GUS Expression in Transgenic Tobacco.
Time course of GUS expression following single (A) and multiple (B) ethanol applications. Plants were activated using a 1% ethanol foliar spray and root drench. Plants within the multiple ethanol treatment group (B) were subjected to additional 1% ethanol foliar sprays each day following initial activation. Tissue was collected concurrently at day 0 and every 24 h for 7 d PEA, from the top three leaves of each plant. GUS levels were quantified by ELISA. Four independent transformation events representing (1) SRN2 + pINPACT-GUS, (2) SRN34 + pINPACT-GUS, and (3) p35S-GSN were used. Samples were collected from three biological replicates of each transgenic event and the wild type (WT) and analyzed in triplicate. Error bars indicate se.

