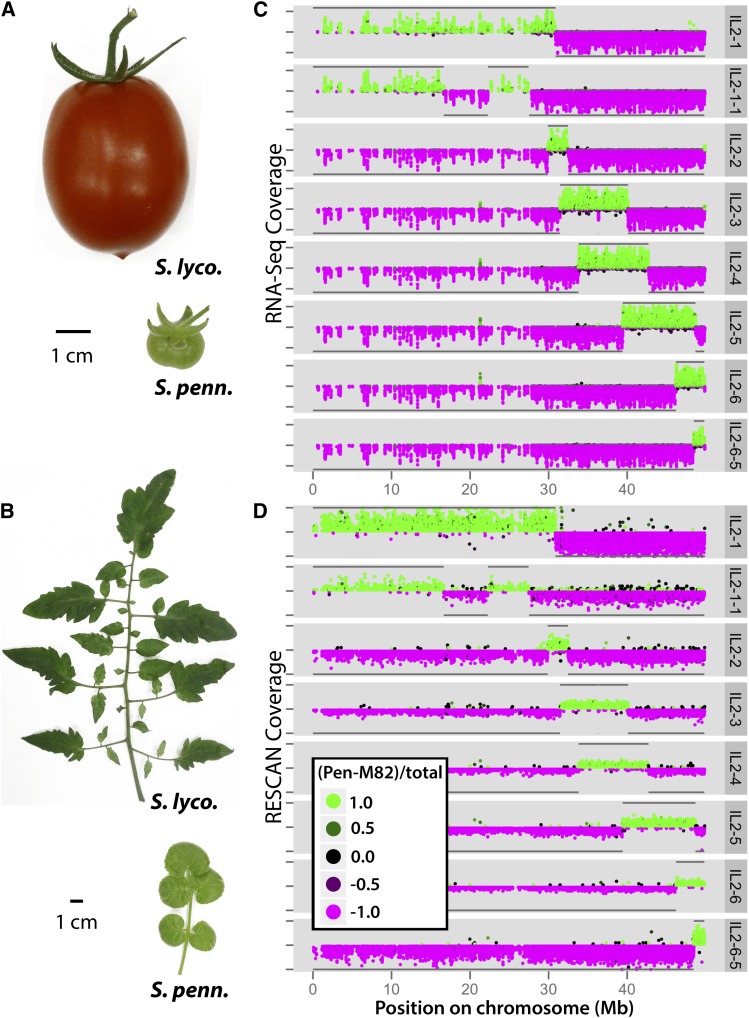
Figure 1.
Phenotypic Differences between IL Parents and RNA-Seq and RESCAN Data for Chromosome 2 ILs.
Phenotypic differences in the fruit (A) and leaves (B) between domesticated tomato (S. lycopersicum) and a wild relative (S. pennellii). Beyond obvious differences in the size, shape, and color of fruits are differences in metabolite content. Leaves between these species vary in size, complexity, and shape and non-cell-autonomously provide the majority of photosynthate to fruits. Shown are the S. pennellii introgression regions for ILs covering chromosome 2 as determined by two methods: RNA-Seq (C) and RESCAN (D). The depth of coverage (distance from midpoint on y axis) and genotype (color and direction on y axis) of each SNP/indel is plotted against chromosomal position (x axis). Polymorphisms that match S. pennellii are colored green and plotted on the top half of each IL panel, while polymorphisms matching cv M82 are plotted in magenta in the bottom halves. The coloring is on a continuum such that the color approaches black as a position’s genotype approaches heterozygosity. The y axis tick marks indicate depths of coverage ranging from 0 to 100 (C) or 0 to 20 (D). Subsequent to genotyping, introgression boundaries consistent between the RNA-Seq and RESCAN analyses were delineated. Using these breakpoints, S. pennellii and cv M82 regions are summarized by horizontal lines at the top and bottom of each IL panel, respectively.

